Histogram and Ogive Class 10 OP Malhotra Exe-19B ICSE Maths Solutions Ch-19. Step by step solutions of questions as latest prescribe guideline for upcoming exam. In this article you would learn to Locating Mode from Histogram Visit official Website CISCE for detail information about ICSE Board Class-10 Mathematics.
Histogram and Ogive Class 10 OP Malhotra Exe-19B ICSE Maths Solutions Ch-19
| Board | ICSE |
| Publications | S Chand |
| Subject | Maths |
| Class | 10th |
| Chapter-19 | Histogram and Ogive |
| Writer | OP Malhotra |
| Exe-19B | Locating Mode from Histogram |
| Edition | 2024-2025 |
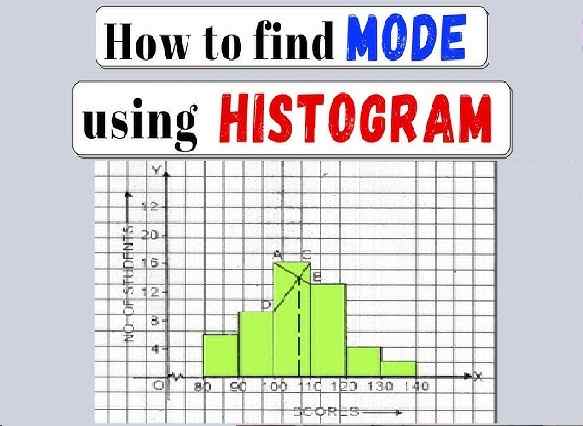
Locating Mode from Histogram
To find the mode in a histogram, we can use the following steps:
- Identify the tallest bar.
- Draw a line from the left corner of the tallest bar to the left corner of the bar immediately after it.
- Draw a line from the right corner of the tallest bar to the right corner of the bar immediately before it.
- Identify the point where the two lines intersect. Then draw a line straight down to the x-axis. The point where the line hits the x-axis is our best estimate for the mode.
Exercise- 19B
Histogram and Ogive Class 10 OP Malhotra Exe-19B ICSE Maths Solutions Ch-19.
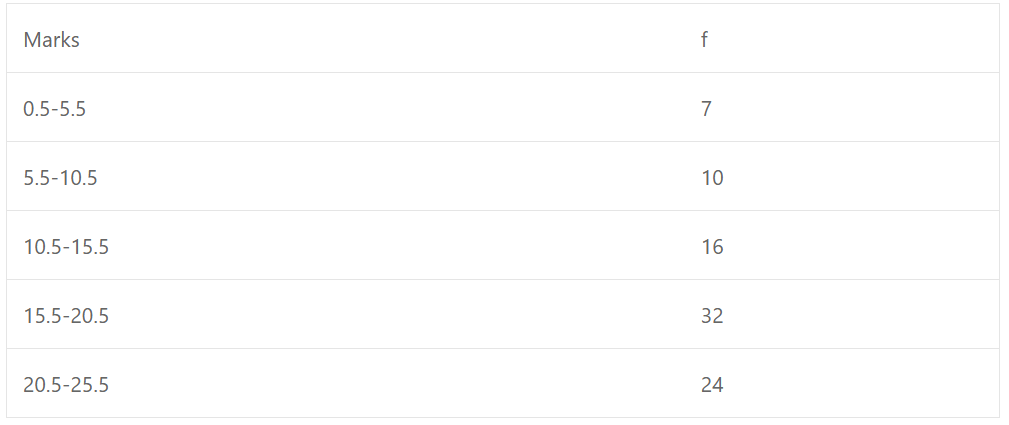
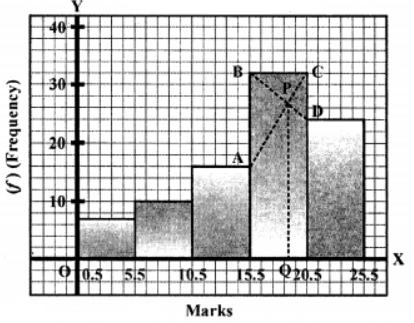
Que-1:
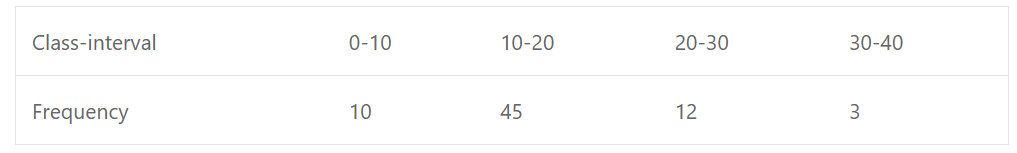
Sol:
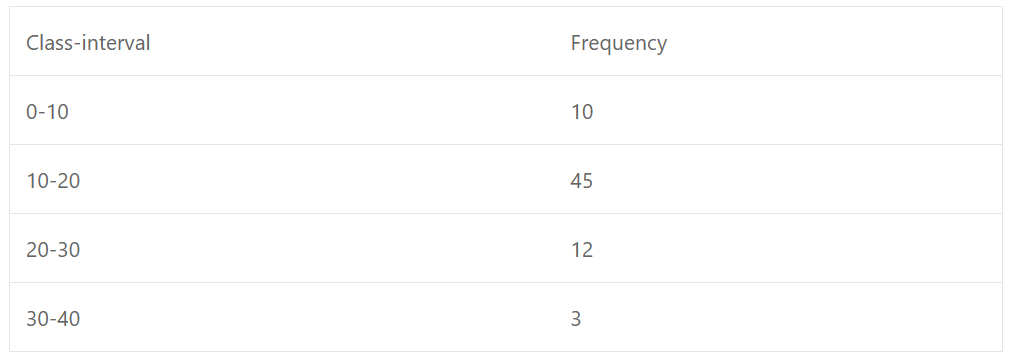
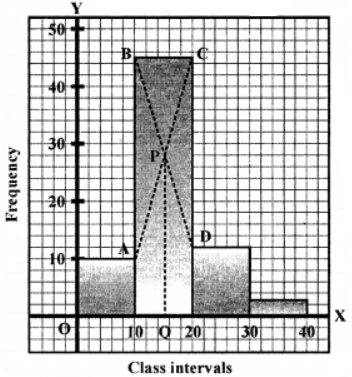
Represent class-intervals along x-axis and frequency along y-axis and draw the histogram as shown here Now inside the highest rectangle we join A to C and B to D intersecting each other at P.
From P, draw PQ perpendicular on x-axis meeting it at Q, then Q is the mode which is 15 (approx)
Que-2:
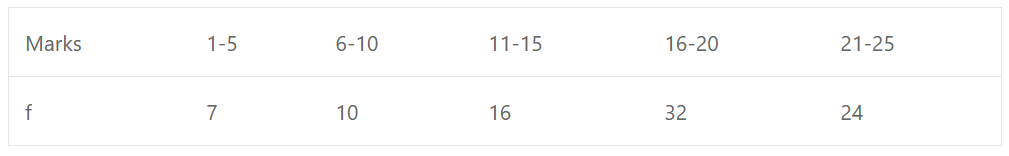
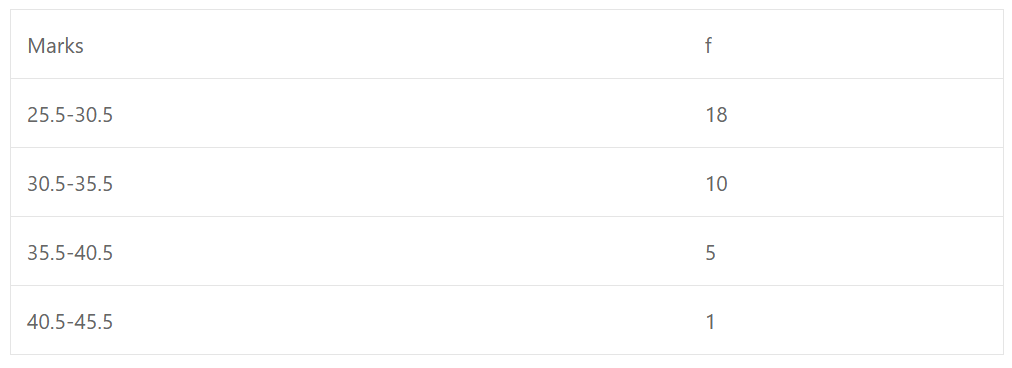
Sol: Writing the classes in exclusive form,
Represent the marks (class interval) along x-axis and f along y-axis and draw the histogram as shown. Now inside the highest rectangle. Join A to C and B to D intersecting each other at P Through P, draw PQ perpendicular on x-axis meeting it at Q, Then Q is the mode which is 18.8 = 19 (approx)
Hence mode = 19 (approx)
Que-3:
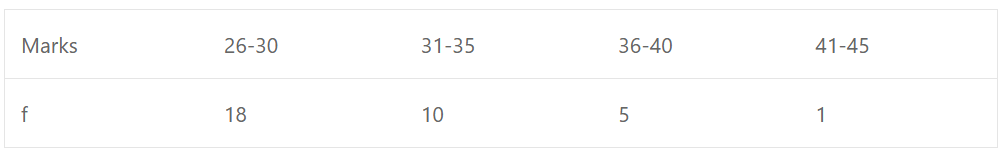
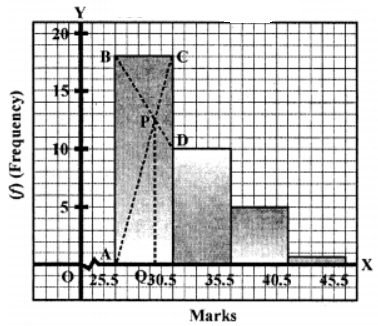
Sol: Writing the classes in exclusive form
Represent marks along x-axis and f along y-axis and draw the histogram as shown. Now inside the highest rectangle, join A to C and B to D which intersect each other at P. Through P, draw PQ perpendicular to x-axis meeting x-axis at Q.
∴ Q is the mode which is 29 (approx)
∴ Mode = 29 (approx)
Que-4:
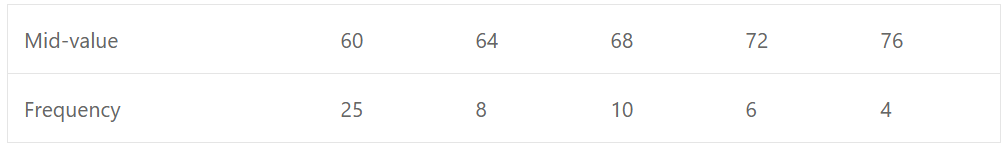
Sol: ∵ Mid value of each class is given
∴ Forming the classes, with these mid values, we get 58-62, 62-66, 66-70, 70-74 and 74-78
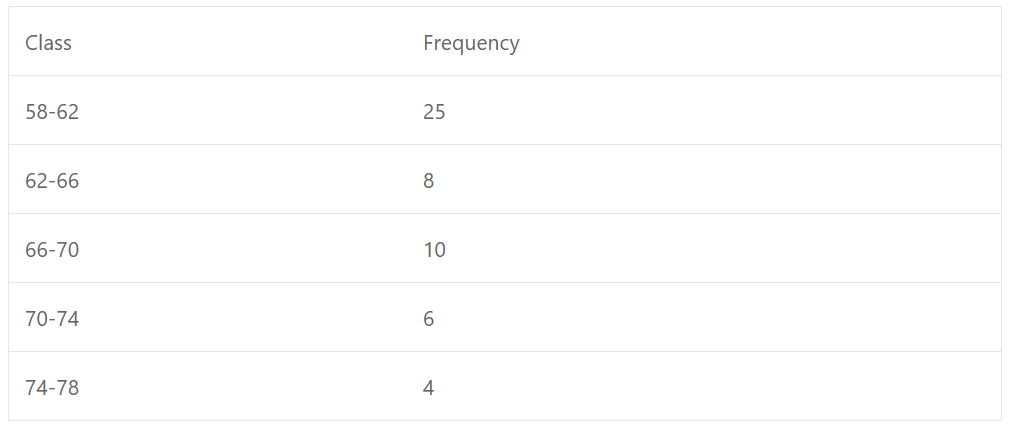
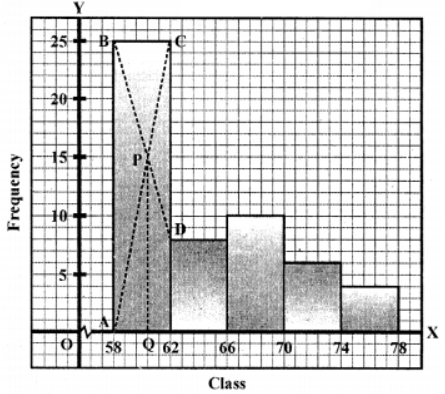
Represent classes along x-axis and frequency along y-axis and draw the histogram as shown. Now inside the highest rectangle, join A to C and B to D intersecting each other at P. Through P, draw PQ perpendicular on x-axis.
Q is the mode which is 60.4 = (approx)
∴ Mode = 60 (approx)
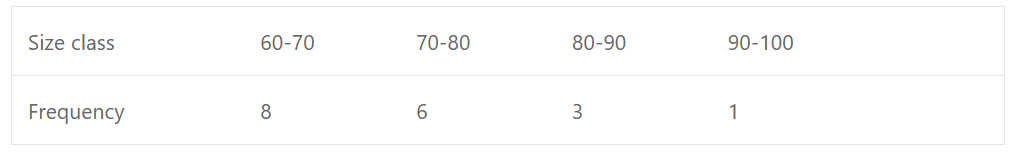
Que-5: Draw a histogram from the following data and measure the modal value :
(a)
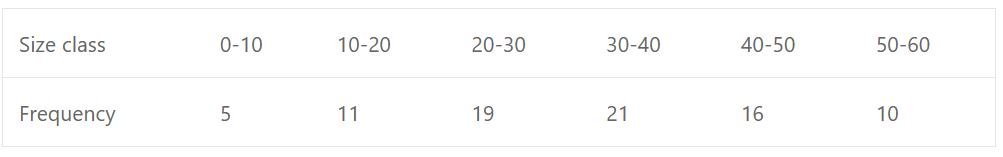 (b)
(b)
Sol: (a) Taking size class along x-axis and frequency along y-axis, and draw the histogram as shown
∴ Mode = 33 (approx)

(b) Taking size class along x-axis and frequency along y-axis, and draw the histogram as shown
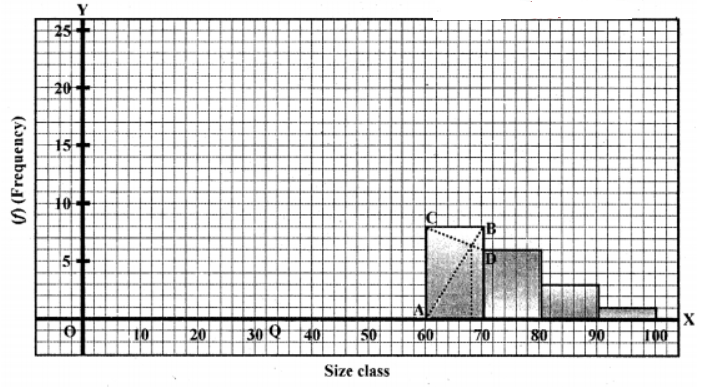
Now inside the highest rectangle, join A to C and B to D intersecting each other at P. Through P, draw PQ perpendicular to x-axis. Q is mode which is 68 (approx)
∴ Mode = 68 (approx)
–: End of Histogram and Ogive Class 10 OP Malhotra Exe-19B ICSE Maths step by Step Solutions :–
Return to : OP Malhotra S Chand Solutions for ICSE Class-10 Maths
Thanks
Please Share with Your Friends