Histogram and Ogive Class 10 OP Malhotra Exe-19D ICSE Maths Solutions Ch-19. We Provide Step by Step Solutions / Answer of Exe-12D Questions of S Chand OP Malhotra Maths . In this article you would learn graphical location of median and quadrilles. Visit official Website CISCE for detail information about ICSE Board Class-10 Mathematics.
Histogram and Ogive Class 10 OP Malhotra Exe-19D ICSE Maths Solutions Ch-19
| Board | ICSE |
| Publications | S Chand |
| Subject | Maths |
| Class | 10th |
| Chapter-19 | Similar Triangles |
| Writer | OP Malhotra |
| Exe-19D | Histogram and Ogive |
| Edition | 2024-2025 |
Exercise- 19D
Histogram and Ogive Class 10 OP Malhotra Exe-19D ICSE Maths Solutions Ch-19
Que-1: Find out the median by plotting the following in the form of an ogive, where ‘m’ denotes the mid-mark of a class :
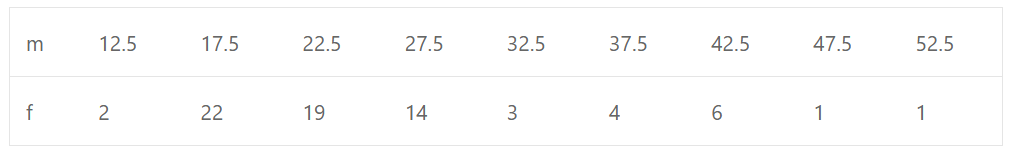
Sol: 12.5, 17.5, etc. are class marks
∴ The corresponding classes will be 10-15, 15-20, etc.
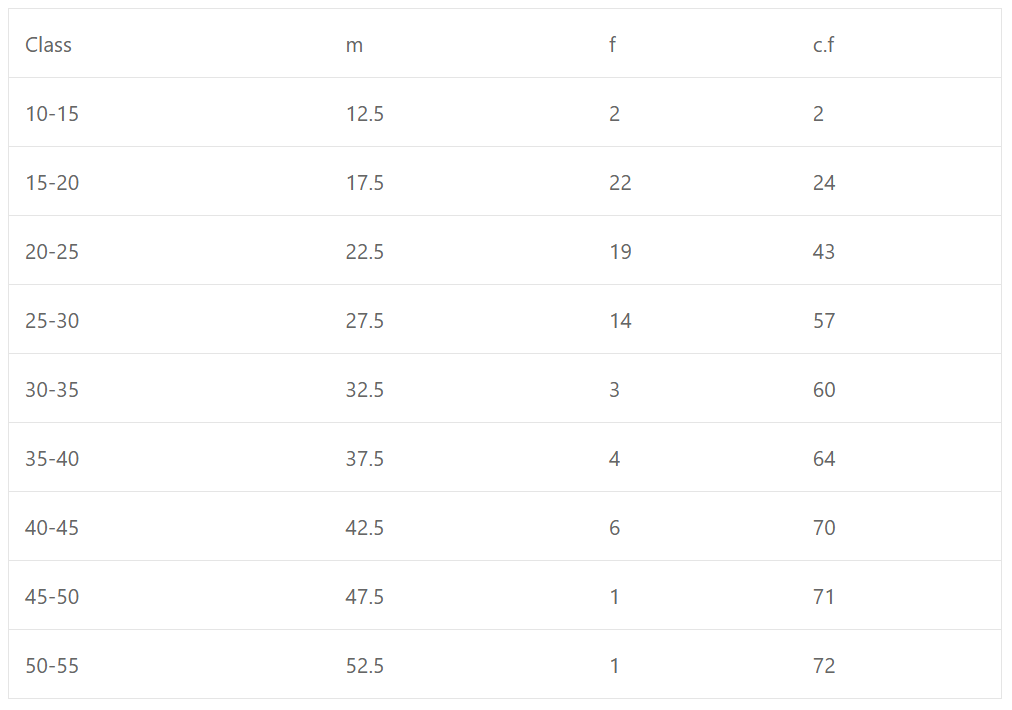
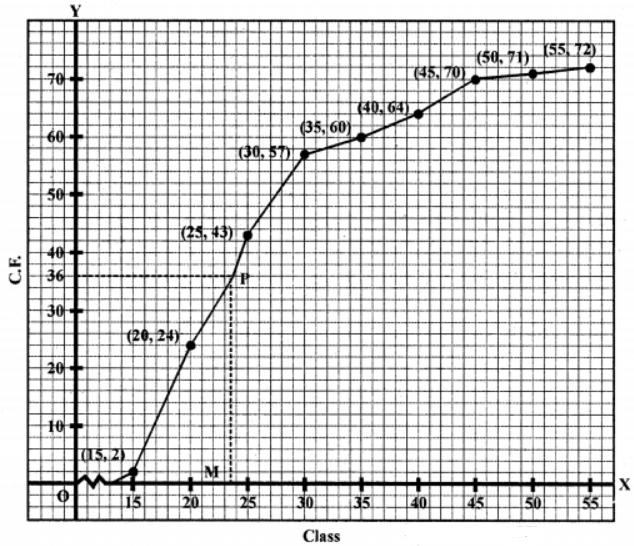
Plot the points (15, 2), (20, 24), (25, 43), (30, 57), (35, 60), (40, 64), (45, 70), (50, 71), (55, 72) on the graph and join them with free hand to get on ogive as shown.
Here n = 72 which is even
∴ Median = n/2
= 72/2 = 36
From 36 on 7-axis, draw a line parallel to x-axis which meets the curve at P. From P, draw a perpendicular, to x-axis which meet it at M which is median.
∴ Median = 23.5 (approx)
Que-2: From the data given below draw an ogive and find the values of median and quartiles from the graph.
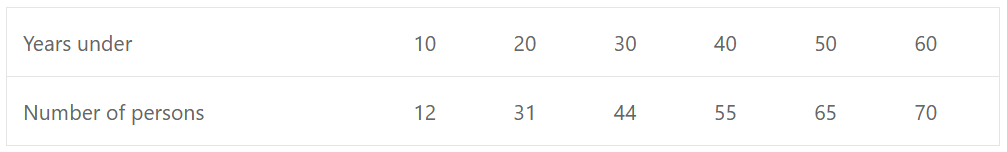
Sol: Now plot the points (10, 12), (20, 31), (30, 44), (40, 55), (50, 65) and (60, 70) on the graph and join them with free hand to get an ogive as shown.
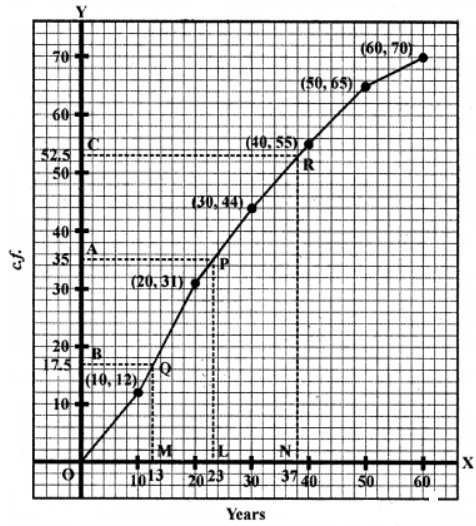
(i) Here in = 70
∴ Median = n/2 = 70/2 th = 35th term.
From 35 (A) on y-axis, draw a line parallel to x-axis meeting the curve at P and from P, draw PL ⊥ x-axis
∴ L is the median which is = 23 years
∴Meadian = 23 years
(ii) First Quartile (Q1) = n/4 = 70/4 = 17.5
From 17.5 (B) on y-axis, draw a line parallel to x-axis meeting the curve at Q and from Q, draw QM ⊥ x-axis
∴ M is the Q1 which is 13 years
(iii) Similarly for Q3 = 3n/4 = (3×40)/4 = 210/4 = 52.5
From 52.5 (C) on y-axis, draw a line parallel to x-axis meeting the curve at R and from R, RN ⊥ x-axis
Then N is the Q3 which is = 37 years
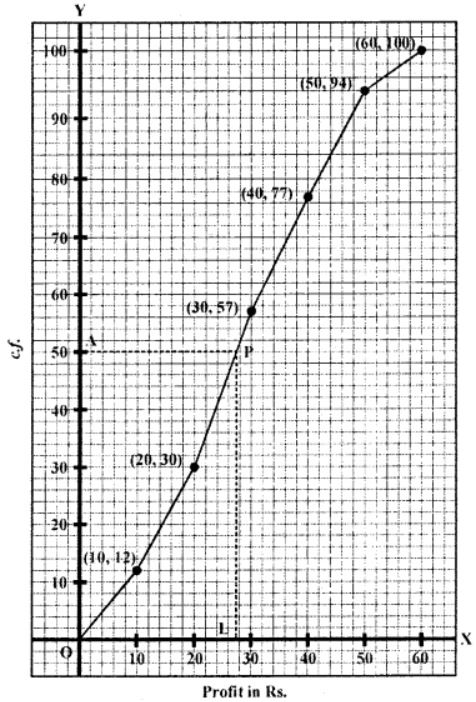
Que-3: From the following find out the median with the help of ogive curve :
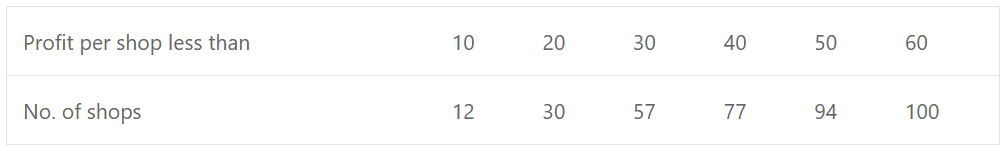
Sol: Plot the points (10, 12), (20, 30), (30, 57), (40, 77), (50, 94) and (60, 100) on the graph and join them to get an ogive.
Here n = 100
∴ Median = n/2 =100/2 th = 50
From 50 (A) on y-axis, draw a line parallel to x-axis which meet the curve at P From P, draw PL ⊥ x-axis which meet it at L
L is the median which is 27.8 (approx)
∴ Median 27.8 or = 28 (approx)
Que-4: The following are the marks obtained by 50 students in Statistics :
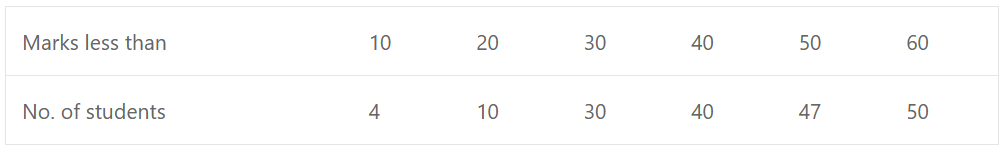
Draw an ogive and find the median marks from it.
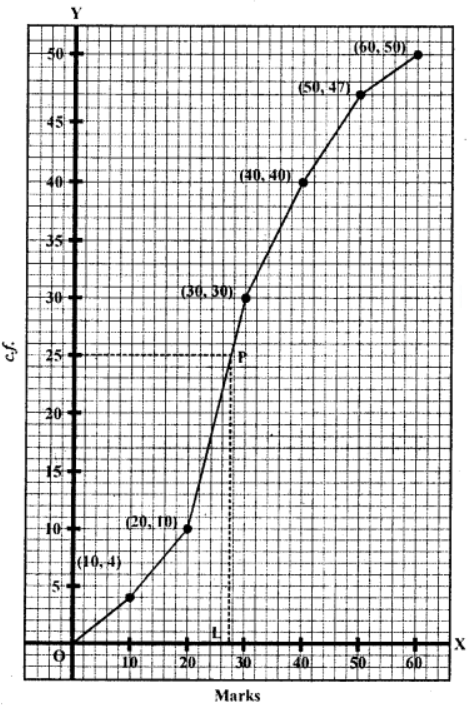
Sol: Plot the points (10, 4), (20, 10), (30, 30), (40, 40), (50, 47) and (60, 50) on the graph and join them with free hand to get an ogive as shown on the graph,
Here n = 50
∴ Median = 50/2 = 25th
From 25 on y-axis, draw a line parallel to x-axis which meets the curve at P. From P, draw a line perpendicular to x-axis which meet it at L
L is the median which is 27.8 = 28
Hence median = 28
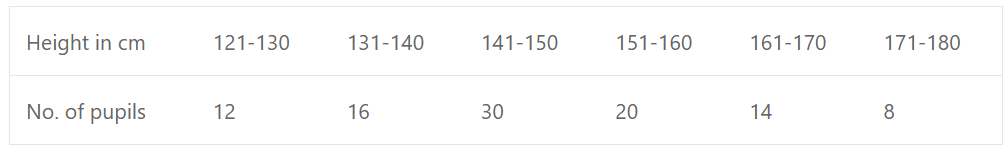
Que-5: 100 pupils in a school have heights as tabulated below :
Draw the ogive for the above data and from it determine the median. (Use graph paper).
Sol: Writing the given class-interval in exclusive form,
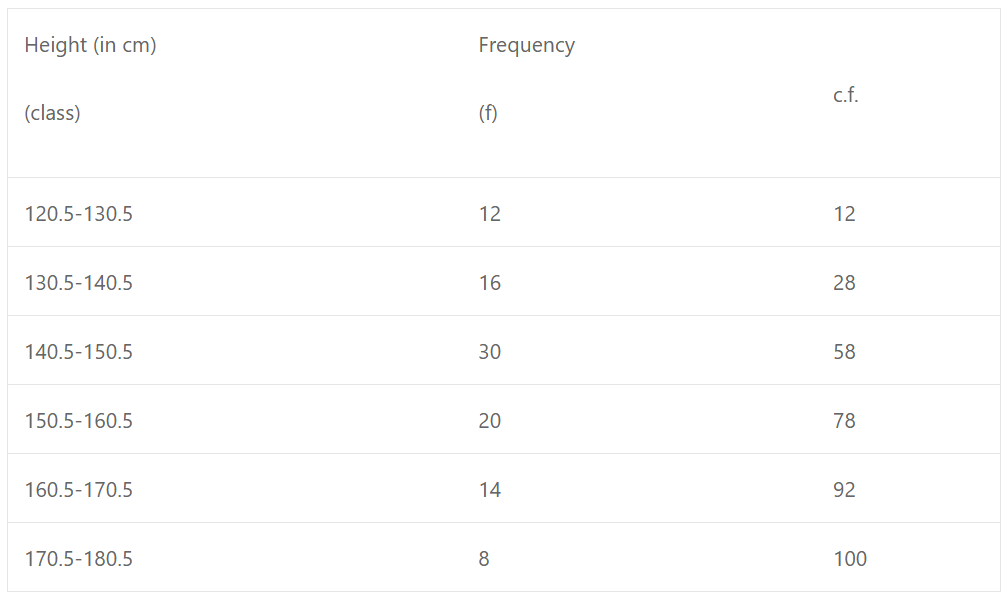
Plot the points (130.5,12), (140.5,28), (150.5,58), (160.5,78), (170.5,92) and (180.5,100) on the graph and join them with free hand to get an ogive as shown.
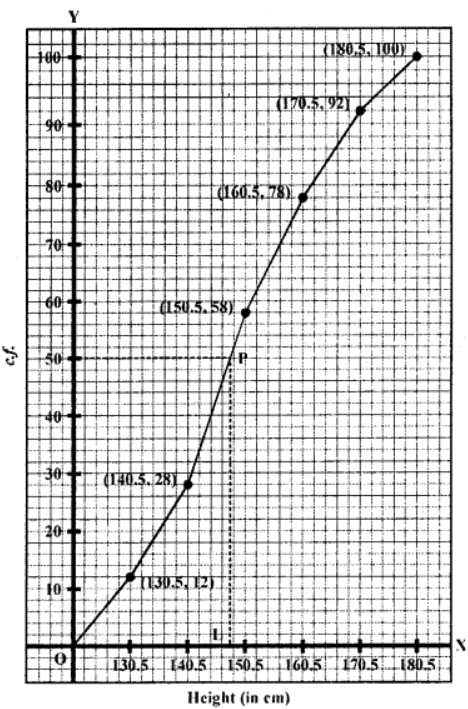
Here n = 100
∴ Median = n/2 = 100/2 = 50th
∴ From 50 on y-axis, draw a line parallel to x-axis which meets the curve at P From P, draw PL ⊥x-axis
Then L is the median which is =147.8
= 148 (approx)
∴ Median =148 (approx)
Que-6: Draw an ogive curve from the following data and find out (a) the median wage and (b) number of workers earning less than Rs. 55 per week :
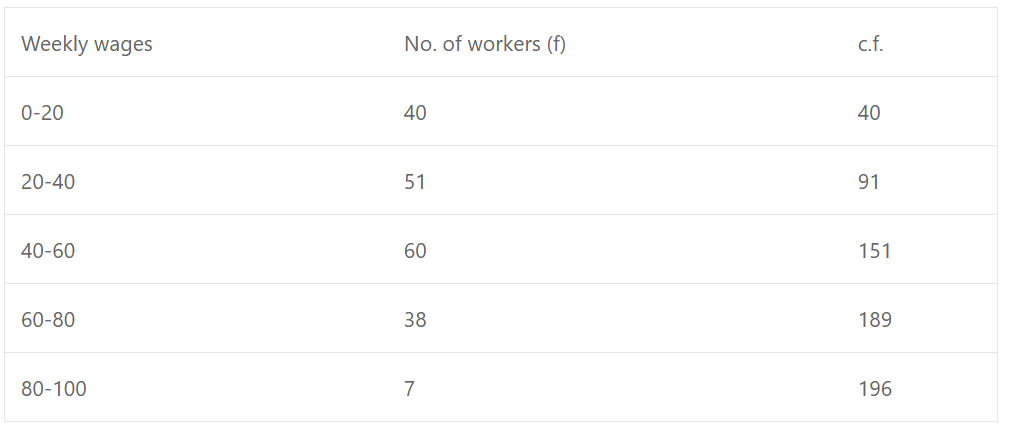
Sol:

We plot the points (20, 40), (40, 91), (60, 151), (80, 189) and (100, 196) on the graph and join them with free hand to get an ogive as shown Here n = 196
∴ Median = n/2 = 196/2 =98
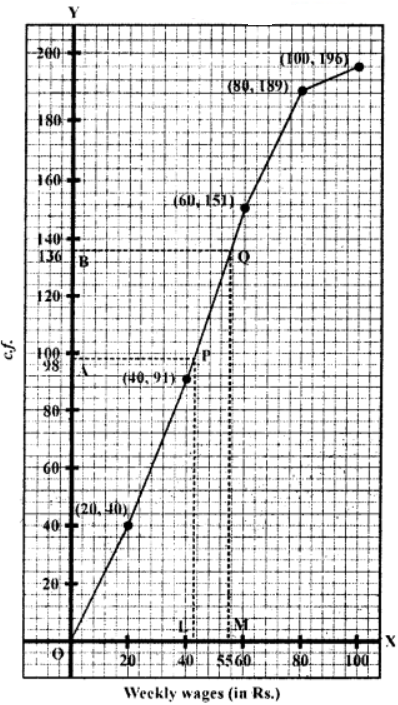
From 98 on y-axis, draw a line parallel to x-axis is which meets the curve at P. From P, draw PL ⊥ x-axis
Then L is the median which is
∴ Median = 42.3.
Que-7: Represent the following data by a cumulative frequency curve and locate the median and quartiles graphically :
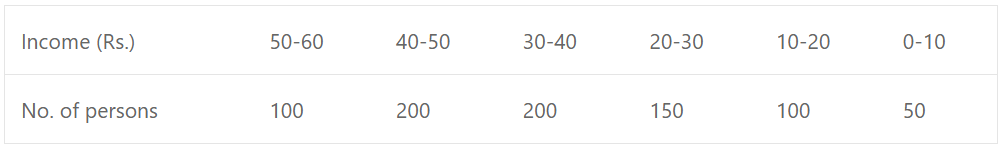
Sol: Now writing in c.f.
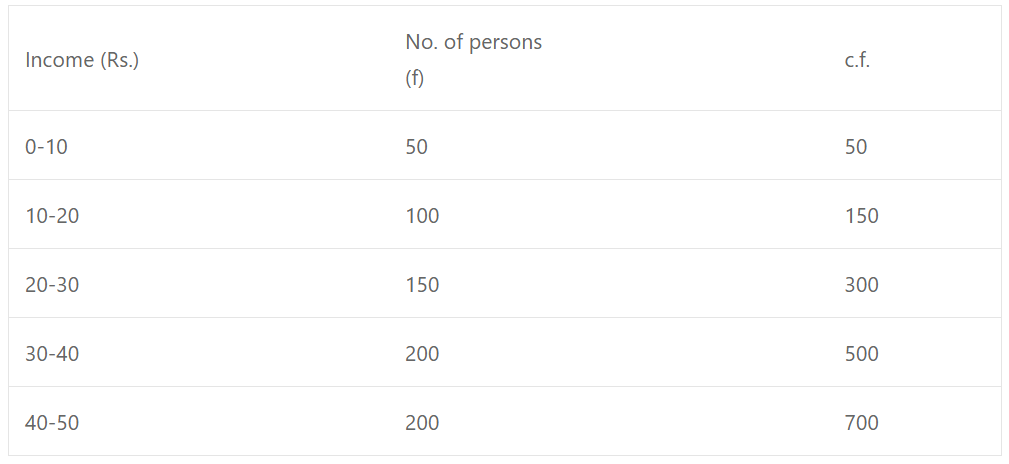
Plot the points (10, 50), (20, 150), (3o, 300), (40, 500), (50, 700) and (60, 800) on the graph and join them with free hand to get an ogive as shown Here n = 800
∴ Median = n/2 th = 800/2 th = 400th term
From 400 on y-axis, draw a line parallel to x-axis which meets the curve at P. From P, draw PL ⊥ x-axis
∴ L is the median which is 35
Hence median = Rs. 35
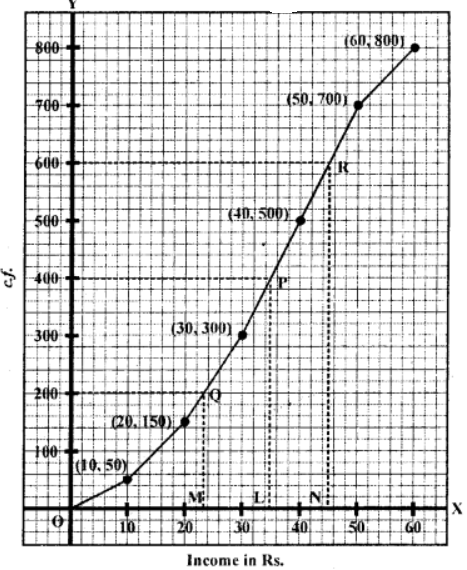
(i) Q1 = n/4 = 800/4 = 200
From 200 on y-axis, draw a line parallel to x-axis which meets the curve at Q.
From Q draw QM ⊥ x-axis
∴ M is the Q1 which is 23
(ii) Q3 = 3n/4 = (3×800)/4 = 600
From 600 on y-axis, draw a line parallel to income in Rs. x-axis which meets the curve at R. From R, draw RN ⊥ x-axis
Then N is Q3 which is 45
Hence Q1 = Rs. 23 and Q3 = Rs. 45
Que-8: Draw the ogive for the following frequency distribution. Estimate the median from your graph :
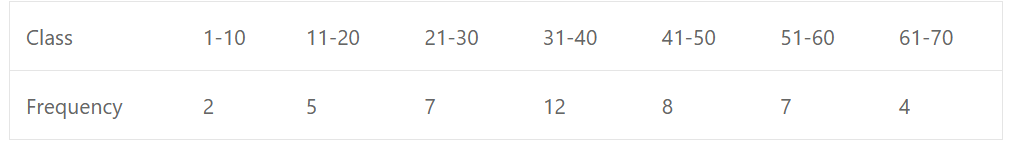
Sol: Writing the class in exclusive form, and in c.f.
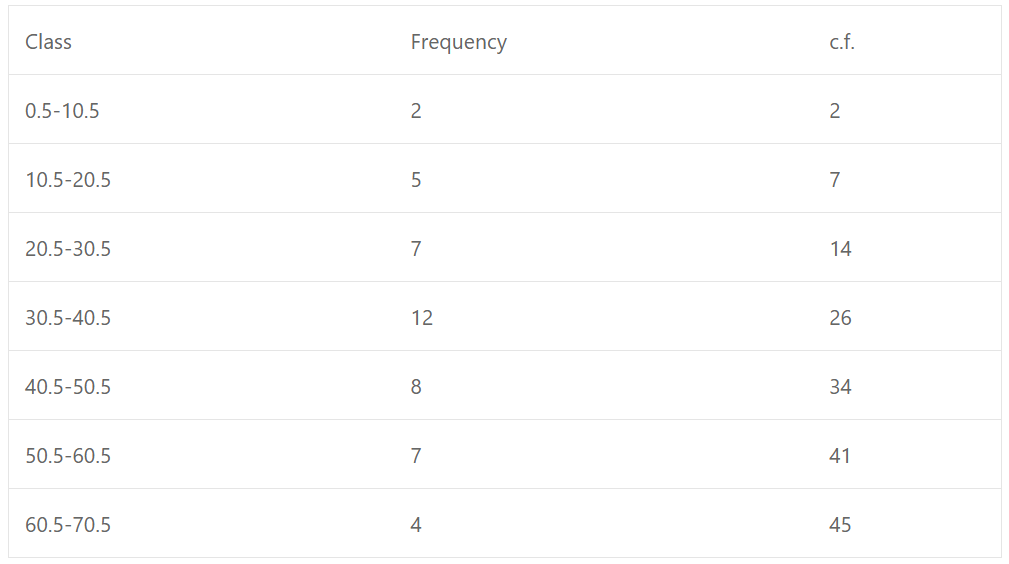
Plot the points (10.5, 2), (20.5, 7), (30.5, 14), (40.5, 26), (50.5, 34), (60.5, 41) and (70.5, 45) on the graph and join them with free hand to get an ogive as shown Here n = 45 which is odd
∴ Median = (n+1)/2 th = (45+1)/2 = 23th
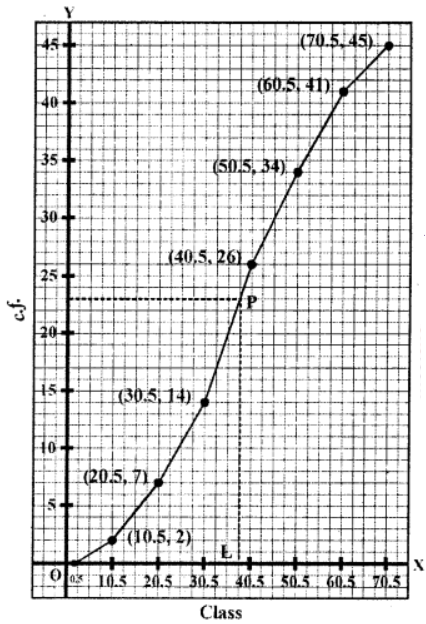
From 23 on y-axis, draw a line parallel to x-axis which meets the curve at P.
From P, draw PL ⊥ x-axis, then L is the median which is (38.1)
Hence median = 38.1
Que-9: Attempt this question on graph paper.
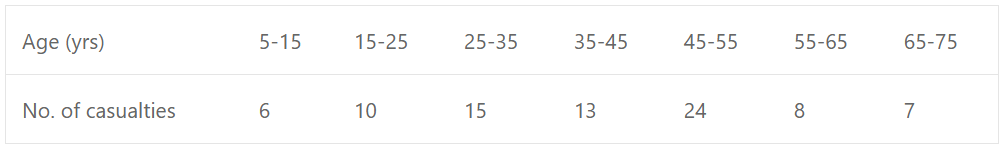
due to accidents
(i) Construct the ‘less than’ cumulative frequency curve for the above data, using 2 cm = 10 years, on one axis and 2 cm = 10 casualties on the other.
(ii) From your graph determine.
(a) The median and
(b) the upper quartile
Sol:
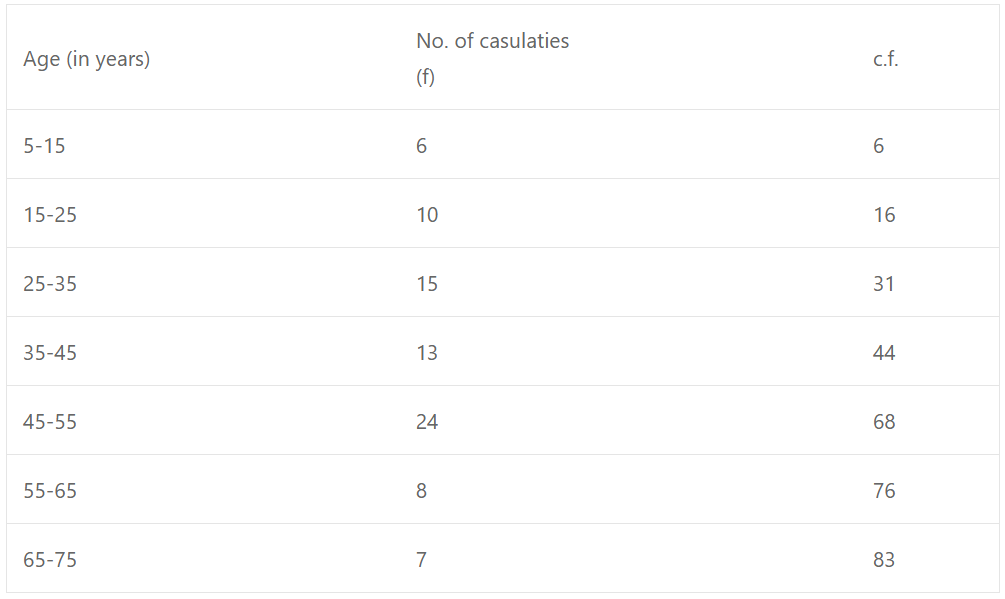
Plot the points (15, 6), (25, 16), (35, 31), (45, 44), (55, 68), (65, 76) and (75, 83) on the graph and join them with free hand to form an ogive (less than)
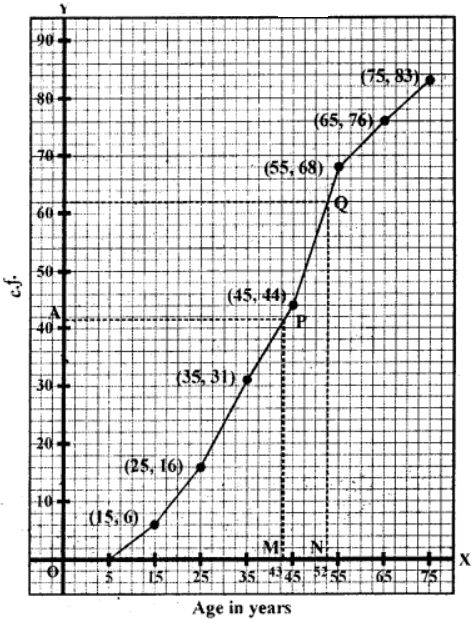
(i) Median, Here n = 83
∴ n/2 = 83/2 = 41.5
From 41.5 on y-axis, draw a line parallel to x-axis meeting the curve at P.
From P draw a perpendicular PM on x-axis
M is the median which is 43 years.
(ii) Upper quartile (Q3) = (3/4) × n = (3/4) × 83
= 249/4 = 62.25
From 62.25 on y-axis, draw a line parallel to x-axis meeting the curve at Q. From Q, draw a perpendicular on x-axis meeting it at N.
N is the upper quadrant which is 52 years
∴ Q3 = 52 years
Que-10: Marks scored by 400 students in an examination are as follows :
Draw an ogive and from it determine:
(i) the median mark,
(ii) pass marks if 80% of the students pass examination.
Sol:
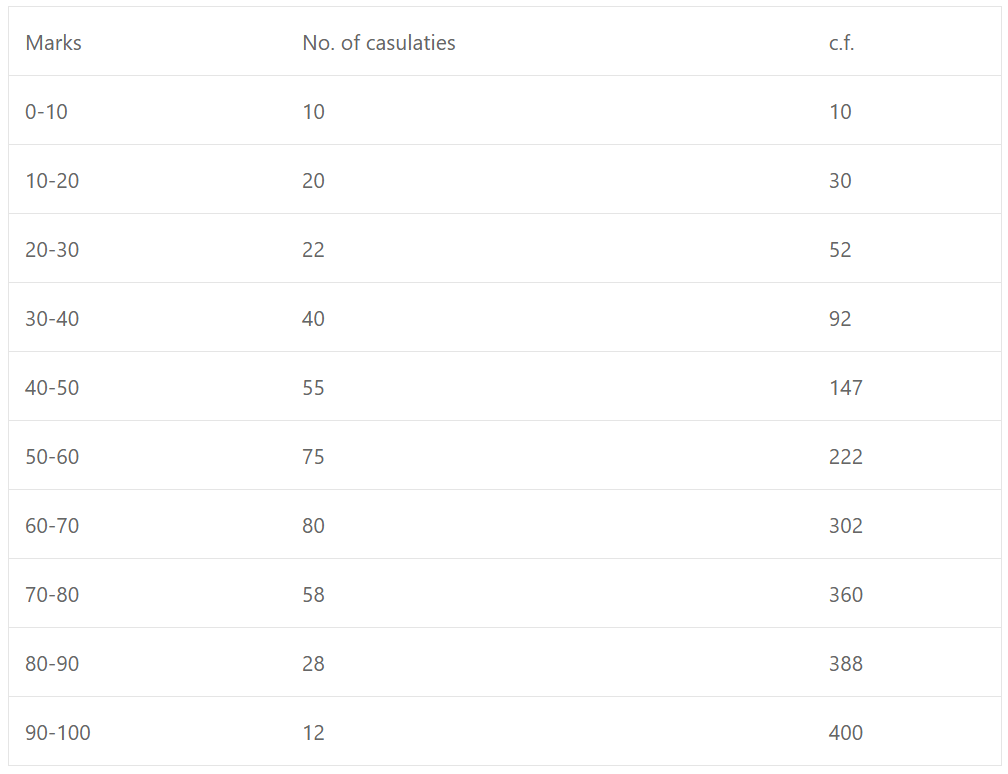
Plot the points (10, 10), (20, 30), (30, 52), (40, 92), (50,. 147), (60, 222), (70, 302), (80, 360), (90, 388), (100,400) on the graph and join them with free hand to form an ogive as shown below:
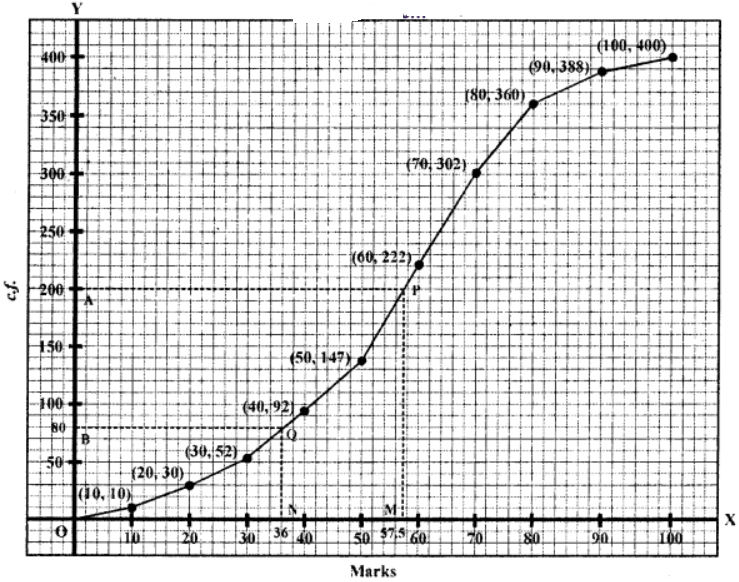
Here n = 400
(i) Median = n/2 = 400/2 = 200
From 200 (A) on y-axis draw a line parallel to x-axis is meeting the curve at P. From P, draw a perpendicular on x-axis meeting it at M.
M is median which is 57.5
∴ Median = 257.5
∵ 80% students passed
(ii) No. of students passed = 80% of 400 = (80/100) × 400 = 320
∴ No. of students who did not pass = 400 – 320 = 80
From a point 80 on y-axis, draw a line parallel to x-axis meeting the curve at Q.
From Q1 draw a line perpendicular to x-axis meeting at N. Then N is the required pass marks.
Which is 36
∴ Pass marks = 36%
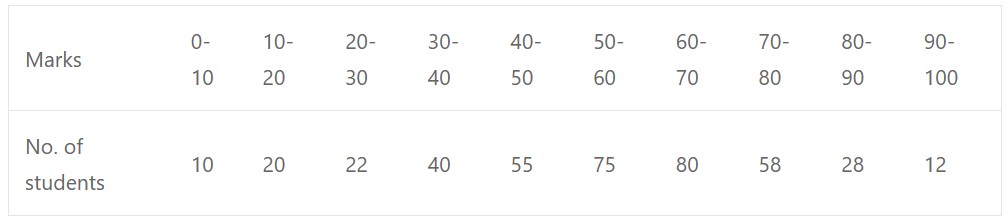
Que-11: Draw an ogive for the following frequency distribution. Use your ogive to estimate
(i) the median
(ii) the number of students who obtained more than 75% marks (use square paper to solve this question).
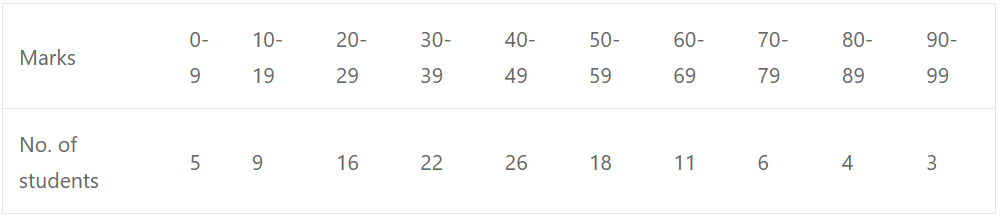
Sol: Writing the classes in exclusive form,
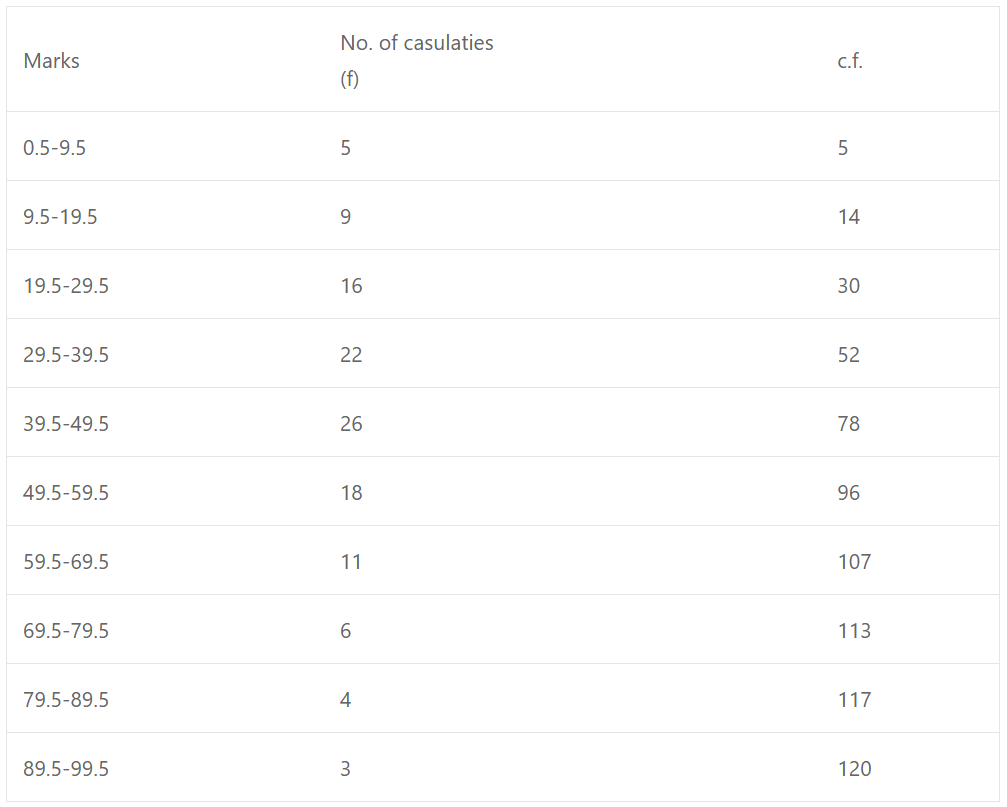
Now plot the points (9.5, 5), (19.5, 14), (29.5, 30), (39.5, 52), (49.5, 78), (59.5, 96), (69.5, 107), (79.5, 113), (89.5, 117), and (99.5, 120) on the graph and join them with free hand to get an ogive as shown below :
Here n = 120
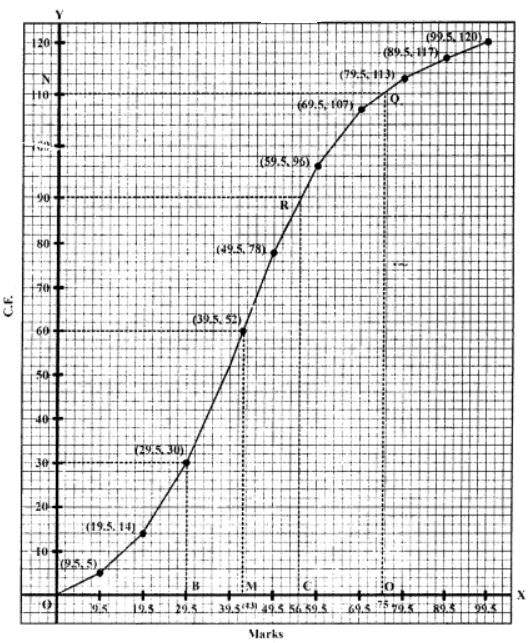
(i) Median: n/2 = 120/2 = 60
From 60 on the y-axis draw a line parallel to x-axis meeting the curves at P. From P, draw a perpendicular on x-axis meeting it at M.
M is the median which is 43
∴ Median = 43
(ii) From 75 on the x-axis draw a line parallel toy-axis meeting the curve at Q. From Q, draw a line perpendicular to y-axis meeting at N.
Now Q = 110
Total no. of students getting more them 75% marks = 120 – 110= 10
Que-12: In a public collection towards the erection of a memorial, 1000 people contributed sums of money varying from Rs. 1 to Rs. 100 (in units of Re. 1). The following table gives the frequency distribution of contribution :
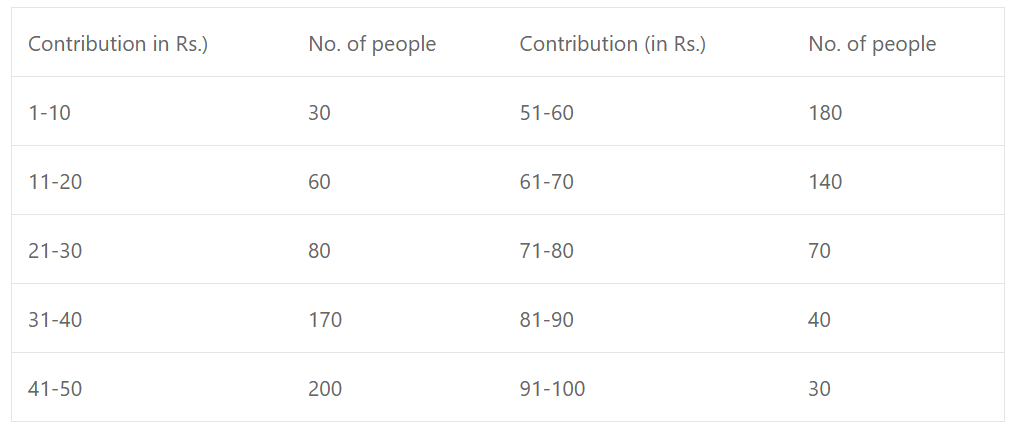
Using a suitable scale, draw on graph paper an ogive (cumulative frequency graph) and use it to answer the following :
(i) Estimate the median.
(ii) If it is agreed to allow only those who contributed Rs. 45 or more to attend the unveilling ceremony, what percentage would attend ?
Sol: Writing the classes in exclusive forms
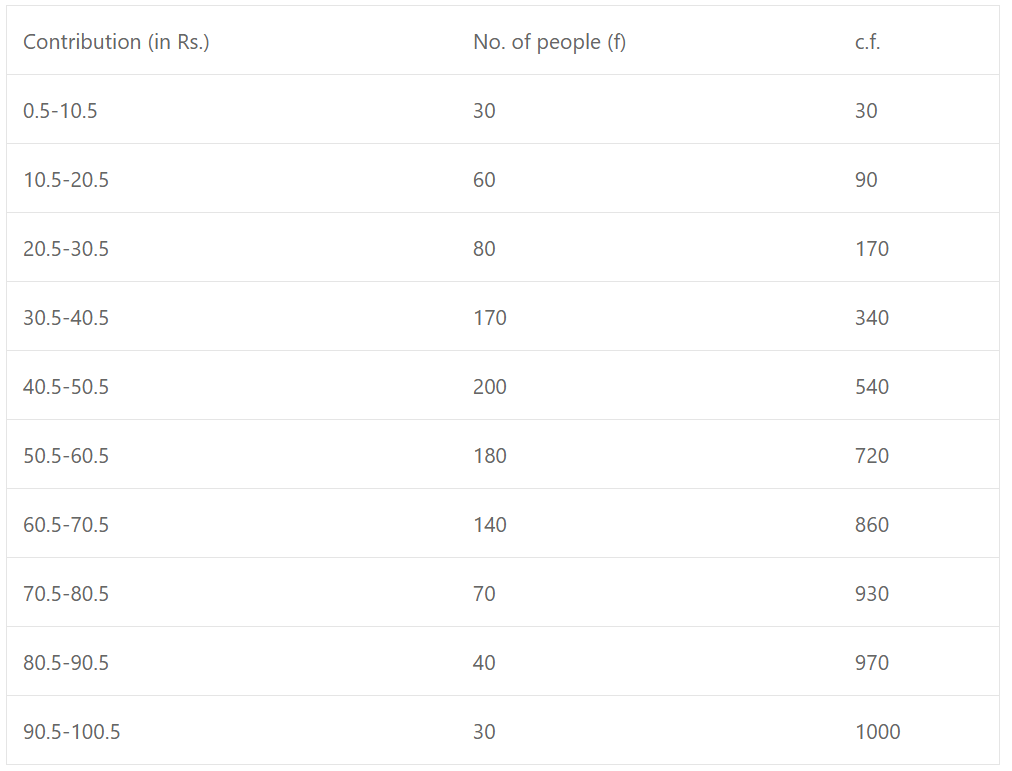
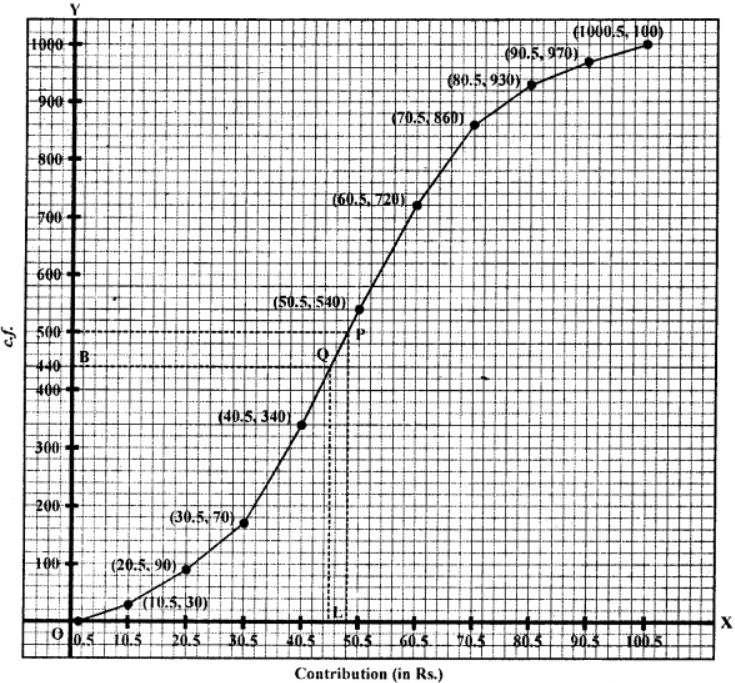
Plot the points (10.5, 30), (20.5, 90), (30.5, 170), (40.5, 340), (50.5, 540), (60.5, 720), (70.5, 860), (80.5, 930), (90.5, 970) and (100.5, 1000) on the graph and join them with free hand to get an ogive as shown.
Here n = 1000
∴ Median = n/2 = 1000/2 = 500th term
From 500 on y-axis; draw a line parallel to x-axis which meets the curve at P. From P, draw PL ⊥ x-axis then L is the median which is 49
∴ Median = 49 rupees
(ii) From Rs. 45 on x-axis, draw a perpendicular which meets the curve at Q and from Q, draw a parallel line to x-axis which meets y-axis at B Then B is 440
∴ Persons who could attend the ceremony = 1000 – 440 = 560
Percentage = (560×100)/1000 = 56%
–: End of Histogram and Ogive Class 10 OP Malhotra Exe-19D ICSE Maths Solutions Ch-19 :–
Return to : OP Malhotra S Chand Solutions for ICSE Class-10 Maths
Thanks
Please Share with Your Friends