Mean Median and Frequency Polygon Class 9 OP Malhotra Exe-15C ICSE Maths Solutions Ch-15. We Provide Step by Step Solutions / Answer of Questions as latest edition. Visit official Website CISCE for detail information about ICSE Board Class-9 Mathematics.
Mean Median and Frequency Polygon Class 9 OP Malhotra Exe-15C ICSE Maths Solutions Ch-15
| Board | ICSE |
| Publications | S Chand |
| Subject | Maths |
| Class | 9th |
| Chapter-15 | Mean Median and Frequency Polygon |
| Writer | OP Malhotra |
| Exe-15C | Solved Problems on Frequency Polygon |
| Edition | 2025-2026 |
Solved Problems on Frequency Polygon
Mean Median and Frequency Polygon Class 9 OP Malhotra Exe-15C ICSE Maths Solutions Ch-15.
Que-1: In a class of 60 boys, the marks obtained in a monthly test were as under :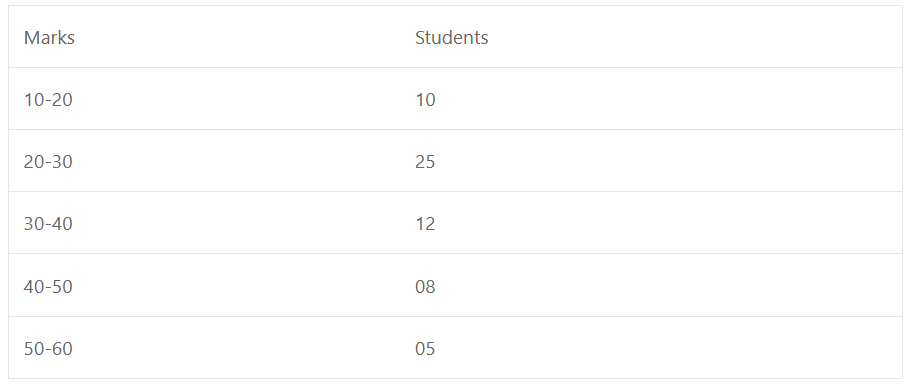
Draw a frequency polygon to represents the above data.
Sol:
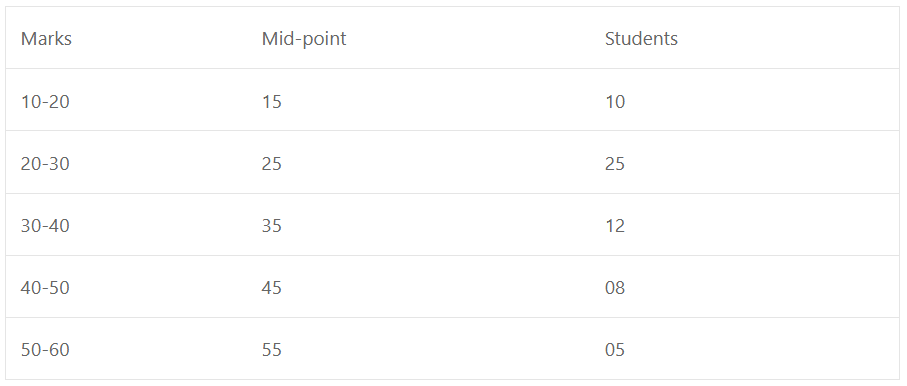
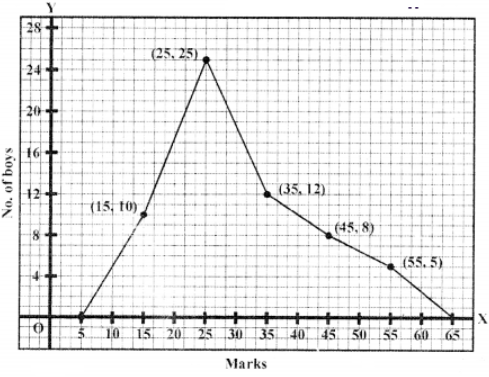
Now plot the points (15, 10), (25, 25), (35, 12), (45, 8) and (55, 5) on the graph and join them and complete the frequency polygon as shown.
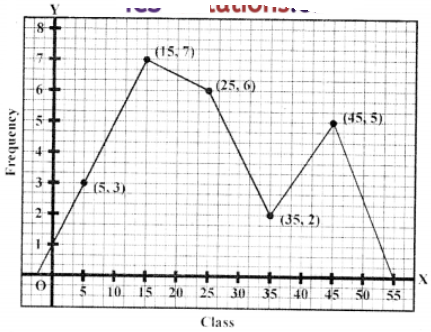
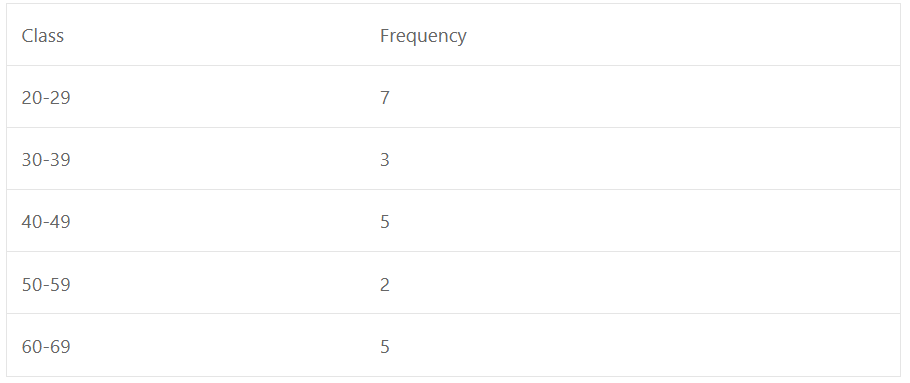
Que-2: Represent the following data by frequency polygon?

Sol:

Now plot the points (5, 3), (15, 7), (25, 6), (35, 2) and (45, 5) on the graph and join them and complete the frequency polygon as shown.
Que-3:
Sol:
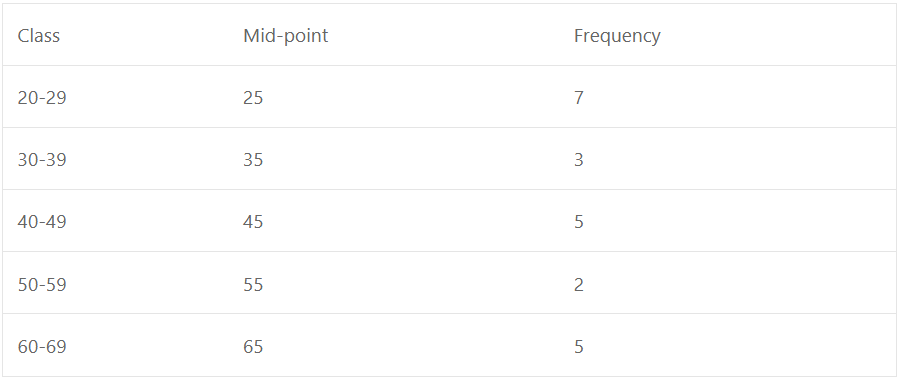
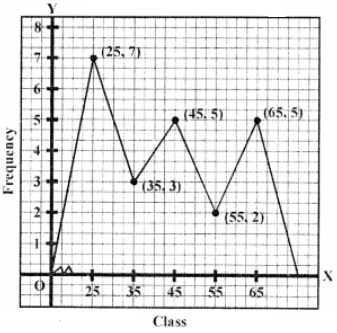
Now plot the points (25, 7), (35, 3), (45, 5), (55, 2) and (65, 5) on the graph and join them and complete the frequency polygon as shown.
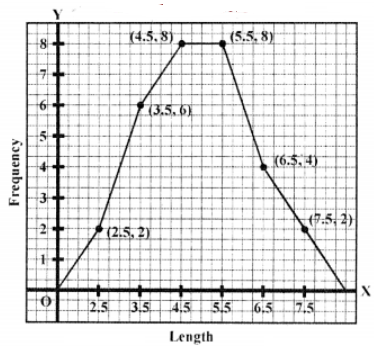
Que-4: Rohit asked people to draw a line 5 cm long using a straight edge without any markings on it. Here are the lengths in centimetres of the lines drawn :
4.3 3.2 3.9 4.7 5.8 6.1 5.7 6.2 6.5 3.7 4.2 5.1 6.5 7.2 7.4 3.7 5.8 4.2 4.1 5.0 5.1 4.7 3.2 3.5 5.2 2.9 2.8 4.3 5.1 4.8
(a) Draw up a grouped frequency table for the data. Use a class interval of 1 centimetre.
(b) Draw a frequency polygon for the data.
Sol: Highest length = ?
Lowest length = 7.4
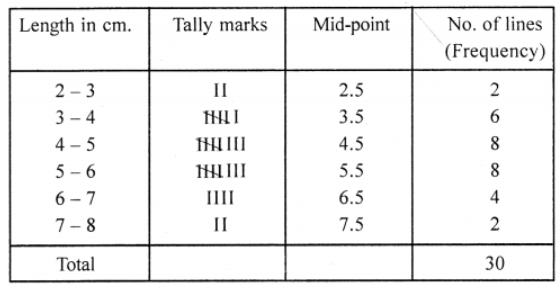
Now plot the points (2.5, 2), (3.5, 6), (4.5, 8), (5.5, 8), (6.5, 4) and (7.5, 2) on the graph and join them and complete the frequency polygon as shown.
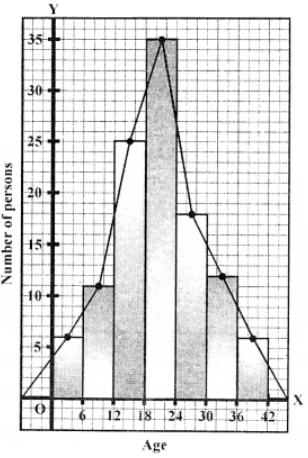
Que-5: For the following data, draw a histogram and a frequency polygon.
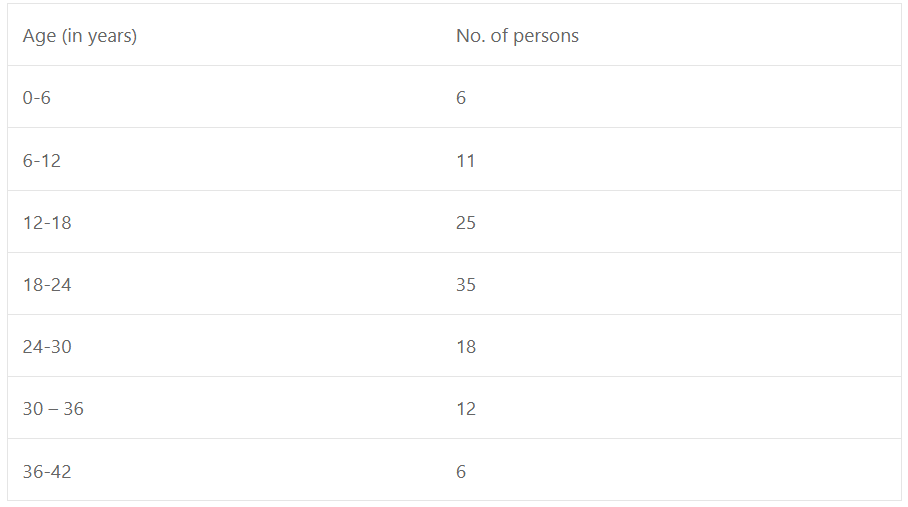
Sol:

Represent age along x-axis and no. of persons on y-axis and complete the histogram. By joining the mid-points of each histogram in order, we get as shown here.
— : End of Mean Median and Frequency Polygon Class 9 OP Malhotra Exe-15C ICSE Maths Solutions Ch-15–
Return to :– OP Malhotra S Chand Solutions for ICSE Class-9 Maths
Thanks
Please Share with Your Friends