ML Aggarwal Data Handling Check Your Progress Class 8 ICSE Ch-19 Maths Solutions. We Provide Step by Step Answer of Check Your Progress Questions for Data Handling as council prescribe guideline for upcoming board exam. Visit official Website CISCE for detail information about ICSE Board Class-8.
ML Aggarwal Data Handling Check Your Progress Class 8 ICSE Maths Solutions
| Board | ICSE |
| Publications | Avichal Publishig Company (APC) |
| Subject | Maths |
| Class | 8th |
| Chapter-19 | Data Handling |
| Writer | ML Aggarwal |
| Book Name | Understanding |
| Topics | Solution of Check Your Progress Questions |
| Edition | 2023-2024 |
Data Handling Check Your Progress
ML Aggarwal Class 8 ICSE Maths Solutions
Page-342
Question 1. Each student from the group of 40 students was asked to roll a dice independently. The results are given below:
2, 3, 3, 4, 1, 5, 2, 6, 1, 4, 2, 3, 4, 4, 6, 1, 5, 5, 2, 4, 5, 5, 3, 1, 6, 5, 4, 2, 3, 6, 1, 1, 4, 4, 5, 3, 2, 2, 6,6
Make a frequency distribution table for the same.
Answer:
Frequency table of the given data is given below:

Question 2. Construct a frequency distribution table for the following weights (in grams) of 35 oranges, using class intervals 40—45, 45-50 and so on.
30, 40, 45, 32, 43, 50, 55, 63, 72, 73, 62, 61, 54, 53, 50, 43, 76, 38, 54, 55, 66, 70, 74, 75, 45, 47, 59, 58, 60, 63, 74, 33, 35, 70, 68.
(i) How many classes are there in the frequency distribution table?
(ii) Which weight group has the lowest frequency?
(iii) Which weight group has the highest frequency?
Answer:
Frequency distribution table is given below:

(i) Number of classes =10.
(ii) Group (class) 35-40, 65-70 and 75-80 have lowest frequency,
(iii) Class 70-75 has the highest frequency.
Question 3. Draw a histrogram of the following data:
Marks obtained by students in a Mathematics Paper of maximum marks 100.
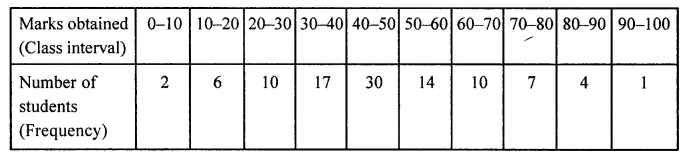
Answer:
The histogram regarding the given data is given here:

Question 4. The following data represents the number of students using different mode of transportation to come to school.
| Mode of transport | Bicycle | School bus | Car | Walking |
| Number of students | 360 | 240 | 80 | 120 |
Draw a pie chart to represent this data.Pie chart is given below:
Answer:

Pie chart is given below:

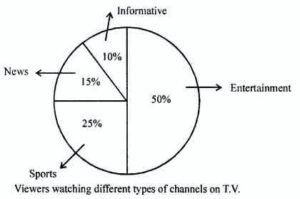
Question 5. Answer the following questions based on the pie chart given below:
(i) Which type of programmes are viewed the most?
(ii) Which type of programmes are viewed the least?
(iii) Which two types of programmes have number of viewers equal to those watching sports channels?
Answer:
From the given pie chart,
(i) Entertainment is viewed the most.
(ii) Informative is viewed the least.
(iii) Viewers of sports is equal to the
sum of the viewers of news and informative.
Data Handling Check Your Progress
ML Aggarwal Class 8 ICSE Maths Solutions
Page-343
Question 6. Suppose you spin the wheel shown in adjoining figure.
(i) List the outcomes of getting a green sector and not getting a green sector on this wheel.
(ii) Find the probability of getting a green sector.
(iii) Find the probability of not getting a green sector.

Answer:
In the spin wheel, 3 sectors are red and 5 sectors are green.
(i) Getting green sector are G, G, G, G, G
and not getting a green sector is R, R, R.
Total number of outcomes = 5 + 3 = 8
(ii) Probability of getting a green sector P(E) = 5/8.
(iii) Probaility of getting a non-green sector P(E) = 3/8
Question 7. A bag has 4 red and 2 yellow balls. A ball is drawn from the bag without looking into the bag. What is the probability of getting
(i) a red ball?
(ii) not a red ball?
Answer:
In a bag, there are 4 red, 2 yellow balls.
∴ Total number of balls = 4 + 2 = 6
(i) One ball is drawn at random.
Probability of getting a red ball = 4/6 = 2/3 .
(ii) Probability of getting not a red ball = 2/6 = 1/3 .
Question 8. Three coins are tossed together, find the probability of getting
(i) atmost 2 heads
(ii) 3 heads.
Answer:
Three coins are tossed together.
∴ Number of total outcomes = (2)3 = 2 × 2 × 2 = 8
(i) Probability of getting at the most 2 heads P(E)
= HTT, HHT, HTH, HTT, THH, TTH, THT = 7
= 7/8
(ii) Probability of getting 3 heads (HHH = 1) = 1/8
Question 9. A letter is chosen from the word ‘RECTANGLE’. What is the probability that it is
(i) a consonant
(ii) not a consonant.
Answer:
In the word ‘RECTANGLE’
Total letters (outcomes) = 9
(i) Probability of a letter which is a consonant P(E) = (R, C, T, N, G, L)
= 6/9 = 2/3
(ii) Probability of a letter being not a consonant (E, A, E), P(E) = 3/9 = 1/3 .
— End of Data Handling Check Your Progress Class 8 ICSE Maths Solutions :–
Return to : – ML Aggarwal Maths Solutions for ICSE Class -8
Thanks