ML Aggarwal Data Handling Exe-19.2 Class 8 ICSE Ch-19 Maths Solutions. We Provide Step by Step Answer of Exe-19.2 Questions for Data Handling as council prescribe guideline for upcoming board exam. Visit official Website CISCE for detail information about ICSE Board Class-8.
ML Aggarwal Data Handling Exe-19.2 Class 8 ICSE Maths Solutions
| Board | ICSE |
| Publications | Avichal Publishig Company (APC) |
| Subject | Maths |
| Class | 8th |
| Chapter-19 | Data Handling |
| Writer | ML Aggarwal |
| Book Name | Understanding |
| Topics | Solution of Exe-19.2 Questions |
| Edition | 2023-2024 |
Data Handling Exe-19.2
ML Aggarwal Class 8 ICSE Maths Solutions
Page-330
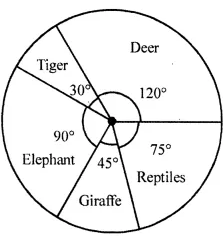
Question 1. The following data represents the different number of animals in a zoo. Prepare a pie chart for the given data.
| Animals | Deer | Tiger | Elephant | Giraffe | Reptiles |
| Number of animals | 40 | 10 | 30 | 15 | 25 |
Answer:
| Animals | Number of animals | Central degree |
| DeerTiger Elephant Giraffe Reptiles |
4010
30 15 25 |
(3600 × 40) / 120 = 1200(3600 × 10) / 120 = 300
(3600 × 30) / 120 = 900 (3600 × 15) / 120 = 450 (3600 × 25) / 120 = 750 |
| Total | 120 | 3600 |
Pie chart for the data is given below:
Data Handling Exe-19.2
ML Aggarwal Class 8 ICSE Maths Solutions
Page-331
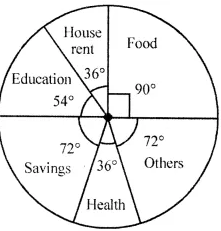
Question 2. The following data represents the monthly expenditure of a family (in T) on various items. Draw a pie chart to represent this data.
| Items | Food | House rent | Education | Savings | Health | Others |
| Expenditure (in Rs) | 12500 | 5000 | 7500 | 10000 | 5000 | 10000 |
Answer:
| Items | Expenditure (in Rs) | Central angles |
| FoodHouse rent
Education Savings Health Others |
125005000
7500 10000 5000 10000 |
(12500 × 3600) / 50000 = 900(5000 × 3600) / 50000 = 360
(7500 × 3600) / 50000 = 540 (10000 × 3600) / 50000 = 720 (5000 × 3600) / 50000 = 360 (10000 × 3600) / 50000 = 720 |
| Total | 50000 | 3600 |
Pie chart representing the above given data is given:
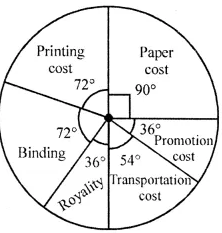
Question 3. The following data represents the percentage distribution of the expenditure incurred in publishing a book.
| Items | Paper cost | Printing cost | Binding | Royalty | Transportationcost | Promotion cost |
| Expenditure (in %) | 25% | 20% | 20% | 10% | 15% | 10% |
Draw a pie chart to represent this data.
Answer:
| Items | Expenditure | Central angles |
| Paper costPrinting cost
Binding Royalty Transportation cost Promotion cost |
25%20%
20% 10% 15% 10% |
(3600 × 25) / 100 = 900(3600 × 20) / 100 = 720
(3600 × 20) / 100 = 720 (3600 × 10) / 100 = 360 (3600 × 15) / 100 = 540 (3600 × 10) / 100 = 360 |
| Total | 100% | 3600 |
Pie chart representing the above given data is given:
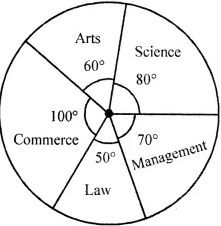
Question 4. The following data represents the number of students got admission in different streams of a college:
| Stream | Science | Arts | Commerce | Law | Management |
| Number of students | 400 | 300 | 500 | 250 | 350 |
Draw a pie chart to represent this data.
Answer:
| Stream | Number of students | Central angle |
| ScienceArts
Commerce Law Management |
400300
500 250 350 |
(400 × 3600) / 1800 = 800(300 × 3600) / 1800 = 600
(500 × 3600) / 1800 = 1000 (250 × 3600) / 1800 = 500 (350 × 3600) / 1800 = 700 |
| Total | 1800 | 3600 |
Pie chart representing the above given data is given below:
Question 5. The adjoining pie chart shows the expenditure of a country on various sports during year 2012. Study the pie chart carefully and answer the following questions:
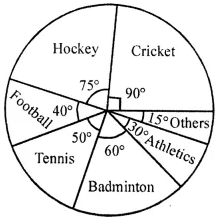
(i) What percent of total expenditure is spent on cricket?
(ii) How much percent more is spent on hockey than that on tennis?
(iii) If the total amount spent on sports in 2012 is ₹1,80,00,000, then find amount spent on Badminton,
(iv) If the total amount spent on sports in 2012 is ₹2,40,00,000 then find the amount spent on cricket and hockey together.
Answer:
The given pie chart represents the expenditure of a country on various sports during the year 2012.
(i) Given that expenditure on a cricket = 900
(90 / 3600) × 100% = 25%
Therefore, 25% of expenditure is spent on cricket
(ii) Given that expenditure on a hockey = 750
(70 / 3600) × 100% = (125 / 6)%
= 20(5/6)%
Expenditure on tennis = 500
Hence, (50 / 3600) × 100% = (125 / 9)% = 13.9%
(125 / 6) – (125 / 9) = 125 / 18
= (375 – 250) / 18
= 125 / 18
= 6.95% more
Therefore, 6.95% more is spent on hockey than that on tennis
(iii) Total amount spent on sports = Rs 1,80,00,000
Total amount spent on Badminton = Rs 1,80,00,000 × (60 / 3600)
= Rs 30,00,000
(iv) If the total amount spent on sports = 2,40,00,000
Total amount spent on cricket and hockey together = 900 + 750
= 1650
= (1650 / 3600) × 2, 40, 00,000
= 1, 10, 00, 000
Question 6. The adjoining pie chart shows the number of students enrolled in class VI to class X of a school.
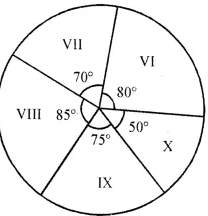
If 1440 students are enrolled from VI to X, then answer the following questions:
(i) How many students are enrolled in class VIII?
(ii) How many students are more in class IX than in class X?
(iii) What is the sum of students enrolled in VII and VIII?
(iv) Find the ratio of students enrolled in VI to students enrolled in X.
Answer:
The given pie chart represents the enrolment of students from class VI to class X in a school.
Total number of students enrolled from VI to X = 1440 students
(i) Enrolment of class VIII = (85 / 3600) × 1440 = 340 students
(ii) Difference in X and IX class enrolment = 750 – 500
= 250
(25 / 3600) × 1440 = 100 students
Therefore, 100 students are more in class IX than in class X
(iii) Sum of students enrolled in VII and VIII classes = 700 + 850
= 1550
(155 / 3600) × 1440 = 620 students
Therefore, the sum of students enrolled in Classes VI and VIII = 620 students
(iv) Ratio between the students enrolled in VI to students enrolled in X classes = 800: 500
= 8: 5
Therefore, the ratio between the students enrolled in VI to students enrolled in X classes is 8: 5
— End of Data Handling Exe-19.2 Class 8 ICSE Maths Solutions :–
Return to : – ML Aggarwal Maths Solutions for ICSE Class -8
Thanks