ML Aggarwal Data Handling MCQs Class 8 ICSE Ch-19 Maths Solutions. We Provide Step by Step Answer of MCQs Questions for Data Handling as council prescribe guideline for upcoming board exam. Visit official Website CISCE for detail information about ICSE Board Class-8.
ML Aggarwal Data Handling MCQs Class 8 ICSE Maths Solutions
| Board | ICSE |
| Publications | Avichal Publishig Company (APC) |
| Subject | Maths |
| Class | 8th |
| Chapter-19 | Data Handling |
| Writer | ML Aggarwal |
| Book Name | Understanding |
| Topics | Solution of MCQs |
| Edition | 2023-2024 |
Data Handling MCQs
ML Aggarwal Class 8 ICSE Maths Solutions
Page-339
Mental Maths
Question 1. Fill in the blanks:
(i) Bar graphs are ……….. representation of ungrouped data.
(ii) In a grouped frequency distribution, the difference between lower limit and upper limit of a class is called ………..
(iii) The mid point of the class interval is called ………..
(iv) Bar graphs of grouped data are called ………..
(v) The circle graphs are commonly called ………..
(vi) An experiment which has more than one possible outcomes and it is not possible to predict the outcome in advance is called ………..
(vii) The outcomes which ensures the occurrence of an event are called ………..
(viii) An event which never happens is called ………..
Answer:
(i) Bar graphs are visual representation of ungrouped data.
(ii) In a grouped frequency distribution, the difference between lower limit and upper limit of a class is called class size or class width.
(iii) The mid point of the class interval is called class mark.
(iv) Bar graphs of grouped data are called histogram.
(v) The circle graphs are commonly called pie chart or pie diagram.
(vi) An experiment which has more than one possible outcomes and it is not possible to predict the outcome in advance is called random experiment.
(vii) The outcomes which ensures the occurrence of an event are called favourable outcomes.
(viii) An event which never happens is called impossible event.
Question 2. State whether the following statements are true (T) or false (F):
(i) The data arranged in ascending or descending order of size is called data array.
(ii) The lower limit of class 10-20 is 20.
(iii) The class size of class 20-30 is 10.
(iv) The class mark of 25-35 is 30.
(v) There is no difference between bar graphs and histograms.
(vi) In histograms the breadth of a rectangle is meaningless.
(vii) In histograms, there is no gap between two adjacent rectangle.
(viii) In a pie chart, size of each sector is proportional to the value of item represented by it.
(ix) In a pie chart angle of sector = value of item/sum of values of all items × 1800
(x) In tossing a coin getting head or tail are equally likely events.
(xi) Probability of an event E satisfies 0 ≤ P(E) ≤ 1.
(xii) P(occurrence of an event) = P(non occurence of an event).
(xiii) Total number of outcomes when two dice are rolled togehter = 6 + 6.
Answer:
(i) The data arranged in ascending or descending order of size is called data array. True
(ii) The lower limit of class 10-20 is 20. False
Correct: Lower limit is 10.
(iii) The class size of class 20-30 is 10. True
(iv) The class mark of 25-35 is 30. True
(v) There is no difference between bar graphs and histograms. False
Correct:
Histogram is for continued classed and in bar graph there is gap between the two bars.
(vi) In histograms the breadth of a rectang is meaningless. False
Correct:
The rectangles are of equal width.
(vii) In histograms, there is no gap between two adjacent rectangle. True
(viii) In a pie chart, size of each sector is proportional to the value of item represented by it. True
(ix) In a pie chart, angle of sector = value of item/sum of values of all items × 1800 . False
Correct:
It is = value of item/sum of values of all items × 360°
(x) In tossing a coin getting head or tail are equally likely events. True
(xi) Probability of an event E satisfies 0 ≤ P(E) ≤ 1. True
(xii) P(occurrence of an event) = P(non-occurence of an event). False
Correct:
Probability is of occurence of an event.
(xiii) Total number of outcomes when two dice are rolled together = 6 + 6. False
Correct: It is 6 × 6 = 36
Data Handling MCQs
ML Aggarwal Class 8 ICSE Maths Solutions
Page-340
MCQs, Data Handling Class-8 ML Aggarwal ICSE Mathematics Solutions Chapter-19
Study the following frequency distribution table:
The table shows the pocket money (in Rs.) per month of 50 students. Choose the correct answer from the given four options for questions 3 to 6;
| Class interval (Pocket money in T) | Frequency (No. of students) |
| 10-20 | 14 |
| 20-30 | 11 |
| 30-40 | 11 |
| 40-50 | 10 |
| 50-60 | 4 |
| Total | 50 |
Question 3. Size of the class-intervals is
(a) 50
(b) 20
(c) 10
(d) 30
Answer:
Size of the class interval is 10. (c)
Question 4. The class having the maximum frequency is
(a) 10-20
(b) 20-30
(c) 30-40
(d) 40-50
Answer:
The class having the maximum frequency is 10-20. (a)
Question 5. The upper limit of the class having minimum frequency is
(a) 30
(b) 40
(c) 50
(d) 60
Answer:
The upper limit of the class having minimum frequency is 60. (d)
Question 6. The frequency of class whose class mark is 25 is
(a) 14
(b) 11
(c) 10
(d) 4
Answer:
25 is the class mark of the class whose frequency is 11. (b)
The pie graph shown in the adjoining figure representing the different subjects liked by the students of class VIII. Study the pie graph carefully and choose the correct answer from the given four options for questions 7 to 10.
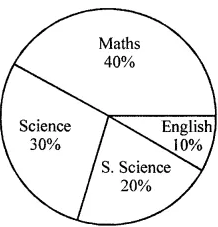
Question 7. Which subject is liked by the maximum number of students
(a) Maths
(b) Science
(c) S. Science
(d) English
Answer:
Mathematics is liked by the maximum number of students. (a)
Question 8. Which subject is liked by the minimum number of students
(a) Maths
(b) Science
(c) S. Science
(d) English
Answer:
English is liked by the minimum number of students. (d)
Question 9. If there are 200 students in class VIII then the number of students who like S. Science
(a) 10
(b) 20
(c) 40
(d) 80
Answer:
In class VIII, there are 200 students,
then the number of students who like S. Science
= 200 × (20/100) = 40 (c)
Question 10. Number of students who like Science
(a) 20
(b) 40
(c) 60
(d) 80
Answer:
Number of students who like science = 200 × 30/100 = 60 (c)
Choose the correct answer from the given four options (12 to 17):
Question 11. Probability of getting exactly 2 heads when three coins are tossed together
(a) 1/8
(b) 1/4
(c) 3/8
(d) 5/8
Answer:
Three coins are tossed,
then total number of outcomes = 23 = 2 × 2 × 2 = 8
Getting two heads (2, 2…), (2…, 2), (…2, 2) = 3
Probability = 3/8 (c)
(ML Aggarwal Data Handling MCQs Class 8 ICSE Maths)
Question 12. Probability of selecting a consonant from the letters of the word ‘FATHER’
(a) 1/3
(b) 3/4
(c) 5/6
(d) 2/3
Answer:
From the letter ‘FATHER’
Total outcomes = 6
∴ Consonant = 4/6 = 2/3 (d)
Question 13. Probability of getting more than 2 heads when a pair of coins is tossed.
(a) 1
(b) 1/2
(c) 1/3
(d) 0
Answer:
A pair of coins tossed, then
Total number of outcomes = 2 × 2 = 4
Getting more than two heads – None
∴ Probability = 0 (d)
Question 14. Probability of getting a red ball from a bag containing 20 red balls
(a) 0
(b) 1
(c) 1/20
(d) 1/2
Answer:
Total red balls = 20
Probability a red ball = 20/20 = 1 (b)
Question 15. Probability of getting a non-red ball from a bag containing 4 red, 5 blue and 3 black balls is
(a) 1/3
(b) 2/3
(c) 1/4
(d) 5/12
Answer:
In a bag, there are 4 red balls, 5 blue and 3 black balls.
∴ Total outcomes = 4 + 5 + 3 = 12
Probability of a non-red ball (5 blue + 3 black) = 8
= 8/12 = 2/3 (b)
Data Handling MCQs
ML Aggarwal Class 8 ICSE Maths Solutions
Page-341
HOTS
Question 1. A bag contains 12 balls out of which x are black.
(i) If a ball drawn at random, what is the probability that it will be a black ball?
(ii) If 6 more black balls are put in the bag, the probability of drawing a black ball will be double than that of (i). Find the value of x.
Answer:
In a bag there are 12 balls, x is black.
(i) A bal1 is drawn at random.
Probability of a ball being black P(E) = x/12
(ii) By putting 6 more black balls, total number of black balls = x + 6
and total balls = 12 + 6 = 18
Now, probability of a black ball = (x+6)/18
According to the condition,
(x+6)/18 = 2 x x/12
6x + 36 = 18 ⇒ 36 = 18x – 6x = 12x
∴ x = 36/12 = 3
Question 2. Ankita and Nagma are friends. They were both born in 1998. What is the probability that they have
(i) same birthday?
(ii) different birthday?
Answer:
Ankita and Nagma both born in 1998.
(i) Probability of being same birth date = 1/365.
(ii) Probability of being different birth dates = (365 – 1)/365 = 364/365.
— End of Data Handling MCQs Class 8 ICSE Maths Solutions :–
Return to : – ML Aggarwal Maths Solutions for ICSE Class -8
Thanks