Motion in One Dimension Exe-2B Graphical Representation of Linear Motions Numericals Type for Class-9 ICSE Concise Physics. There is the solutions of Numericals Answer type Questions of your latest textbook which is applicable in 2023-24 academic session. Visit official Website CISCE for detail information about ICSE Board Class-9.
Motion in One Dimension Exe-2 B Graphical Representation of Linear Motions Numericals
(ICSE Class – 9 Physics Concise Selina Publishers)
| Board | ICSE |
| Class | 9 |
| Subject | Physics |
| Writer / Publication | Concise selina Publishers |
| Chapter-2 | Motion in One Dimension |
| Exe – 2 B | Graphical Representation of Linear Motions |
| Topics | Solution of Exe-2(B) Numericals Type |
| Academic Session | 2023-2024 |
Exe-2B Graphical Representation of Linear Motions Numericals Type
Ch-2 Motion in One Dimension Physics Class-9 ICSE Concise
Page 54
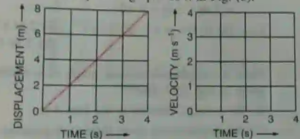
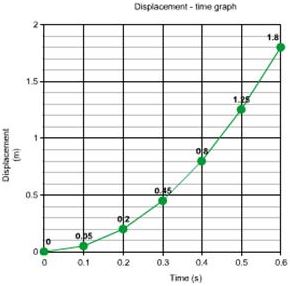
Question 1. Fig. 2.33 (a) shows the displacement-time graph for the motion of a body. Use it to calculate the velocity of body at t = 1 s, 2 s and 3 s, and then draw the velocity-time graph in Fig. (b) for it.
Answer :
Velocity of body at t = 1s is 2 m/s
Velocity of body at t = 2s is 4 m/s
Velocity of body at t = 3s is 6 m/s
Question 2. The following table gives the displacement of a car at different instants of time.

(a) Draw the displacement-time sketch and find the average velocity of the car.
(b) What will be the displacement of the car at
(i) 2.5 s and (ii) 4.5 s?
Answer :
Displacement-time graph
From the part AB of the graph,
Average velocity = (Displacement at B – Displacement at A)/Time taken
= (30 – 20) m/( 6 – 4) s
= (10/2) m/s
= 5 m/s
(b) (i) From the graph, the displacement of car at 2.5 s is 12.5 m.
(ii) From the graph, the displacement of car at 4.5 s is 22.5 m.
Question 3. A body is moving in a straight line and its displacement at various instants of time is given in the following table
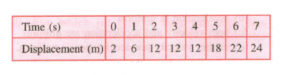
Plot the displacement-time graph and calculate
(i) Total distance travelled in the interval 1 s to 5 s.
(ii) Average velocity in time interval 1 s to 5 s.
Answer :

(i) Total distance travelled in interval 1s to 5s = 18m – 6m = 12 m.
(ii) Average velocity = Total displacement in the given time interval/Time interval, i.e. 1 s to 5 s.
Or, Average velocity = 12 m/4 s = 3 m/s.
Question 4. In Fig. 2.34, the displacement of a body is shown at different times.

(a) Calculate the velocity of the body as it moves for (i) 0 to 5 s, (ii) 5 s to 7 s and (iii) 7 s to 9 s.
(b) Calculate the average velocity during the time interval 5 s to 9 s.
[Hint : From 5 s to 9 s, displacement = 7 m – 3 m = 4 m]
Answer :
(a)
(i) Velocity from 0 to 5 s = Displacement /time
= (3/5) m/s
= 0.6 m/s-1
(ii) Velocity from 5 s to 7 s = Displacement /time
= (0/2) m/s
= 0 m/s-1.
(iii) Velocity from 7 s to 9 s = Displacement /time
= (7 – 3)/(9 – 7) m/s
= (4/2) m/s
= 2 m/s-1
(b)
From, 5 s to 9 s, displacement = 7m – 3m = 4m.
Time elapsed between 5 s to 9 s = 4 s
Average velocity = Displacement/time
= (4/4) m/s
= 1 m/s-1
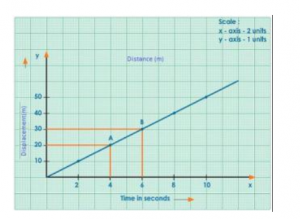
Question 5. From the displacement-time graph of a cyclist given below in the Fig. 2.35, find
(i) The average velocity in the first 4 s,
(ii) The displacement from the initial position at the end of 10 s,
(iii) The time after which he reaches the starting point.
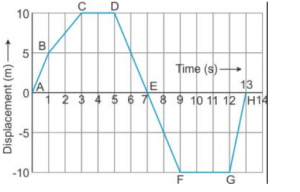
Answer :
(i) Displacement in first 4s = 10 m
Therefore, the average velocity = Displacement/time
= (10/4) m/s
= 2.5 m/s-1
(ii) Initial position = 0 m
Final position at the end of 10 s = -10m
Displacement = Final position – Initial position
= (-10) m – 0
= -10 m
(iii) At 7 s and 13 s, the cyclist reaches his starting point.
Exe-2B Graphical Representation of Linear Motions Numericals Type
Ch-2 Motion in One Dimension Physics Class-9 ICSE Concise
Page 55
Question 6. Fig. 2.40 ahead below represents the displacement-time sketch of motion of two cars A and B. Find
(i) The distance by which the car B was initially ahead of car A.
(ii) Velocities of car A and car B.
(iii) The time in which the car A catches car B.
(iv) The distance from start when the car A will catch car B.
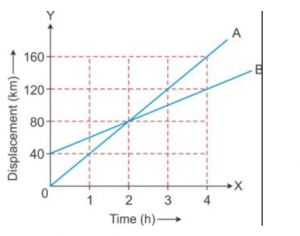
Answer :
(i) Initially, the car B was 40 km ahead of car A.
(ii) Straight line depicts that cars A and B are moving with uniform velocities.
For car A
Displacement at t = 1 h is 40 m
Velocity = Displacement /time
= (40/1) km/h
= 40 km/h-1
For car B
Displacement at t = 4 h is (120 – 40) km, i.e. 80 km
Velocity = Displacement /time
= (80/4) km/h
= 20 km/h-1
(iii) Car A catches car B in 2 hours.
(iv) After starting, car A will catch car B at 80 km.
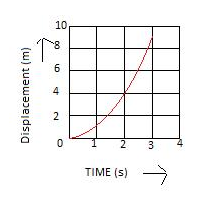
Question 7. A body at rest is made to fall from the top of a tower. Its displacement at different instants is given in the following table:
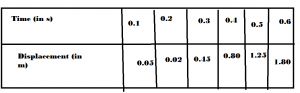
Draw a displacement-time graph and state whether the motion is uniform or non-uniform.
Answer :
The graph is curve therefore the motion is with non-uniform velocity.
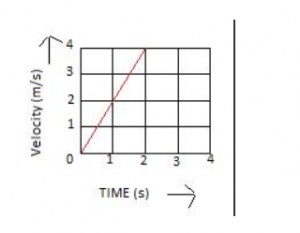
Question 8. Fig. 2.37 (a) shows the velocity-time graph for the motion of a body. Use it to find the displacement of the body at t = 1 s, 2 s, 3 s and 4 s, then draw on Fig. 2.41(b), the displacement-time graph for it.
……………………………
Answer :
Velocity of the body at t = 1 s is 1 m/s.
Displacement of the body at t = 1 s is velocity × time = (1) × (1) m or 1 m.
Velocity of the body at t = 2s is 2 m/s.
Displacement of the body at t = 1 s is velocity × time = (2) × (2) m or 4 m.
Velocity of the body at t = 3 s is 3 m/s.
Displacement of the body at t = 3 s is velocity × time = (3) × (3) m or 9 m
Question 9. Fig. 2.38 given below shows a velocity-time graph for a car starting from rest. The graph has three parts AB, BC and CD.
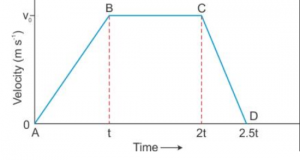
(i) State how the distance travelled in any part is determined from this graph.
(ii) Compare the distance travelled in part BC with the distance travelled in part AB.
(iii) Which part of graph shows motion with uniform (a) velocity (b) acceleration (c) retardation?
(iv)
(a) Is the magnitude of acceleration higher or lower than that of retardation? Give a reasons.
(b) Compare the magnitude of acceleration and retardation.
Answer :
(i) Distance travelled in any part of the graph can be determined by finding the area enclosed by the graph in that part with the time axis.
(ii) Distance travelled in part BC = Area of the rectangle tBC2t = base × height.
= (2t – t) × vo
= vot
Distance travelled in part AB = Area of the triangle ABt
= (1/2) × base × height
= (1/2) × t × vo
= (1/2) vo t
Therefore, distance travelled in part BC:distance travelled in part AB :: 2:1.
(iii)
(a) BC shows motion with uniform velocity.
(b) AB shows motion with uniform acceleration.
(c) CD shows motion with uniform retardation.
(iv)
(a) The magnitude of acceleration is lower as the slope of line AB is less than that of line CD.
(b) Slope of line AB = vo/t
so Slope of line CD = vo/0.5t
and Slope of line AB/Slope of line CD = (vo /t)/(vo /0.5t)
hence Slope of line AB:Slope of line CD :: 1:2.
Question 10. The velocity-time graph of a moving body is given below in Fig. 2.43.
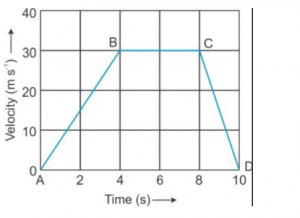
Find
(i) The acceleration in parts AB, BC and CD.
(ii) Displacement in each part AB, BC and CD.
(iii) Total displacement.
Answer:
(i) Acceleration in the part AB = Slope of AB
= tan (∠BAD)
and = (30/4) ms-2
hence = 7.5 ms-2
Acceleration in the part BC = 0 ms-2
Acceleration in the part CD = slope of CD = -tan (∠CDA)
= -(30/2) ms-2
= -15 ms-2
(ii) Displacement of part AB = Area of ΔAB4 = (1/2) (4) (30)
= 60 m
Displacement of part BC = Area of rectangle 4BC8
= (30) × (4) = 120 m
Displacement of part CD = Area of ΔC8D = (1/2) (2) (30)
= 30 m
(iii) Total displacement = Displacement of part AB + Displacement of part BC + Displacement of part CD
= 60 + 120 + 30 = 210 m
Question 11. A ball moves on a smooth floor in a straight line with uniform velocity 10 m s-1 for 6 s. At t = 6 s, the ball hits a wall and comes back along the same line to the starting point with the same speed. Draw the velocity-time graph and use it to find the total distance travelled by the ball and its displacement.
Answer :
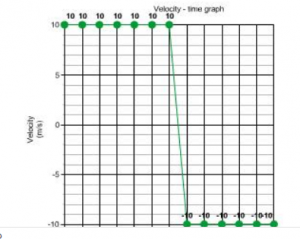
Distance travelled in first 6 s = velocity × time
= 10 m/s × 6
= 60 m/s
Distance travelled in next 6 s = velocity × time
= 10 m/s × 6
= 60 m/s
Total distance travelled in 12 s = (60 + 60) m = 120 m
Total displacement = 0, as the ball returns its starting point.
Exe-2B Graphical Representation of Linear Motions Numericals Type
Ch-2 Motion in One Dimension Physics Class-9 ICSE Concise
Page 56
Question 12. Fig. shows the velocity-time graph of a particle moving in a straight line.
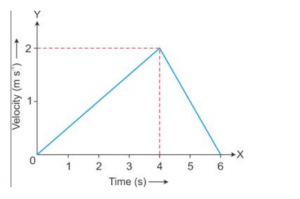
(i) State the nature of motion of particle.
(ii) Find the displacement of particle at t = 6 s.
(iii) Does the particle change its direction of motion?
(iv) Compare the distance travelled by the particle from 0 to 4 s and from 4 s to 6 s.
(v) Find the acceleration from 0 to 4 s and retardation from 4 s to 6 s
Answer :
(i) Uniformly accelerated from 0 to 4 s and then uniformly retarded from 4 s to 6 s.
(ii) 6m
(iii) No
(iv) 2 : 1
(v) acceleration = m0.5 ms-2 retardation = 1ms-2
— : End of Motion in One Dimension Exe-2B Graphical Representation of Linear Motions Numericals Type Solutions :–
Return to:– Concise Selina Physics ICSE Class-9 Solutions
Thanks
Please share with your friends