ML Aggarwal Measures of Central Tendency Chapter Test Class 10 ICSE Maths Solutions. We Provide Step by Step Answer of Chapter Test Questions for Measures of Central Tendency as council prescribe guideline for upcoming board exam. Visit official Website CISCE for detail information about ICSE Board Class-10.
ML Aggarwal Measures of Central Tendency Chapter Test Class 10 ICSE Maths Solutions
| Board | ICSE |
| Subject | Maths |
| Class | 10th |
| Chapter-21 | Measures of Central Tendency |
| Writer / Book | Understanding |
| Topics | Solutions of Chapter Test |
| Academic Session | 2024-2025 |
Measures of Central Tendency Chapter Test
ML Aggarwal Class 10 ICSE Maths Solutions
Question 1. The mean of 20 numbers is 18. If 3 is added to each of the first ten numbers, find the mean of new set of 20 numbers.
Answer :
Mean of 20 numbers =18
Total number = 18 × 20 = 360
By adding 3 to first 10 numbers,
The new sum will be = 360 + 3 × 10 = 360 + 30 = 390
New Mean = (390/20) = 19.5
Question 2. The average height of 30 students is 150 cm. It was detected later that one value of 165 cm was wrongly copied as 135 cm for computation of mean. Find the correct mean.
Answer :
In first case,
Average height of 30 students = 150 cm
Total height = 150 × 30 = 4500 cm
Difference in copying the number = 165 – 135 = 30 cm
Correct sum = 4500 + 30 = 4530 cm
Correct mean = (4530/30) = 151 cm
Question 3. There are 50 students in a class of which 40 are boys and the rest girls. The average weight of the students in the class is 44 kg and average weight of the girls is 40 kg. Find the average weight of boys.
Answer :
Total students of a class = 50
No. of boys = 40
No. of girls = 50 – 40 = 10
Average weight of 50 students = 44 kg
Total weight = 44 × 50 = 2200 kg
Average weight of 10 girls = 40 kg
.’. Total weight of girls = 40 × 10 = 400 kg
Then the total weight of 40 boys = 2200 – 400 = 1800kg
Average weight of boys = 188/40 = 45kg
Question 4. The heights of 50 children were measured (correct to the nearest cm) giving the following results :

Answer :
Calculate the mean height for this distribution correct to one place of decimal.
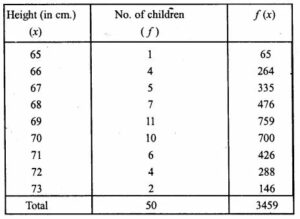
Mean = Ʃfx/Ʃf
= 3459/50
= 69.18 = 69.2
Question 5. Find the value of p if the mean of the following distribution is 18.

Answer :
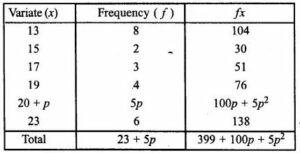
Mean = Ʃfi xi / Ʃfi
18 = (399+5p2+100p)/( 23+5p) [Given mean = 18]
18(23+5p) = 399+5p2+100p
414 + 90p = 399+5p2+100p
5p2+100p-90p+399-414 = 0
5p2+10p-15 = 0
Dividing by 5, we get
p2+2p-3 = 0
(p-1)(p+3) = 0
p-1 = 0 or p+3 = 0
p = 1 or p = -3
p cannot be negative.
So p = 1
Hence the value of p is 1.
Question 6. Find the mean age in years from the frequency distribution given below:

Answer :
Arranging the classes in proper form
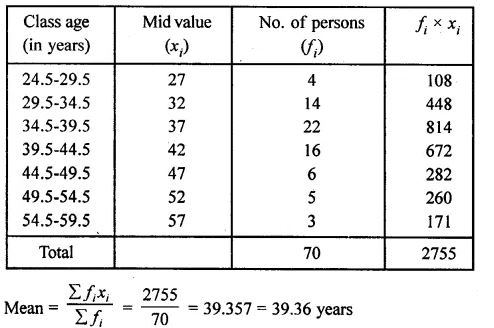
Question 7. The mean of the following frequency distribution is 62.8. Find the value of p.

Answer :
Mean = 62.8
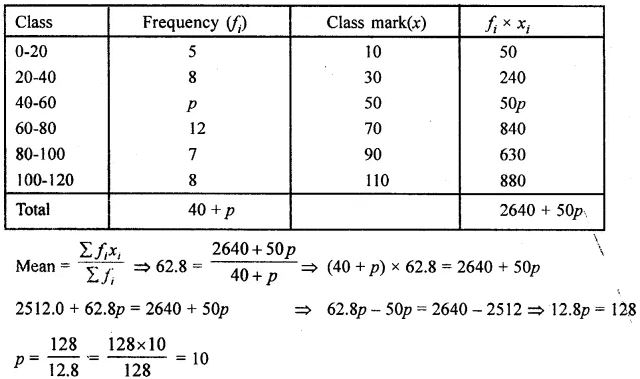
Hence p = 10
Question 8. The daily expenditure of 100 families are given below. Calculate f1, and f2, if the mean daily expenditure is Rs 188.

Answer :
Mean = 188,
No. of families = 100
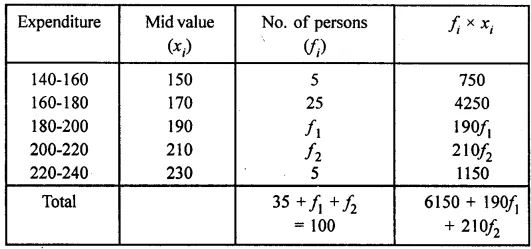
Given no. of families = 100
So 35+f1+f2 = 100
f1+f2 = 100-35 = 65
f1 = 65-f2 ..(i)
Mean = Ʃfi xi / Ʃfi
188 = (6150+190f1+210f2)/100 [Given mean = 188]
188(100) = 6150+190f1+210f2
18800 = 6150+190f1+210f2
18800-6150 = 190f1+210f2
12650 = 190f1+210f2 ..(ii)
Substitute (i) in (ii)
12650 = 190(65-f2)+210f2
12650 = 12350-190f2+210f2
12650-12350 = -190f2+210f2
300 = 20f2
f2 = 300/20 = 15
Put f2 in (i)
f1 = 65-15
f1 = 50
Hence the value of f1 and f2 is 50 and 15 respectively.
Question 9. The median of the following numbers, arranged in ascending order is 25. Find x, 11, 13, 15, 19, x + 2, x + 4, 30, 35, 39, 46
Answer :
Here, n = 10, which is even

But median is given = 25
So, x + 3 = 25
x = 25 – 3
= 22
Question 10. If the median of 5, 9, 11, 3, 4, x, 8 is 6, find the value of x.
Answer :
Arranging in ascending order, 3, 4, 5, x, 8, 9, 11,
Here n = 7 which is odd.
∴ Median = (n + 1)/2 th term = (7 + 1)/2 = 4th term = x
but median = 6
Hence ∴ x = 6
Question 11. The marks scored by 16 students in a class test are : 3, 6, 8, 13, 15, 5, 21, 23, 17, 10, 9, 1, 20, 21, 18, 12
Find:
(i) the median
(ii) lower quartile
(iii) upper quartile
Answer :
Arranging the given data in ascending order:
1, 3, 5, 6, 8, 9, 10, 12, 13, 15, 17, 18, 20, 21, 21, 23
Here n = 16 which is even.
(i) So median = ½ ( n/2 th term + ((n/2)+1)th term)
= ½ (16/2 th term + ((16/2)+1)th term)
= ½ (8 th term + (8+1)th term)
= ½ (8 th term + 9th term)
= ½ (12+13)
= ½ ×25
= 12.5
(ii) Lower quartile, Q1 = (n/4) th term
= (16)/4
= 4 th term
= 6
(iii) Upper quartile, Q3 = (3n/4) th term
= (3×16/4) th term
= (3×4)th term
= 12 th term
= 18
Question 12. Calculate the mean, the median and the mode of the following distribution :

Answer :
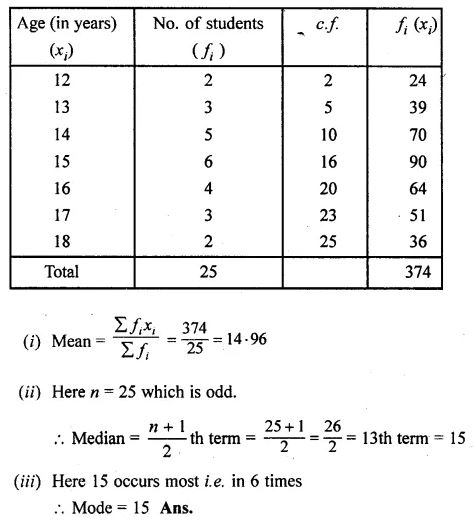
Question 13. The daily wages of 30 employees in an establishment are distributed as follows :

Estimate the modal daily wages for this distribution by a graphical method.
Answer :
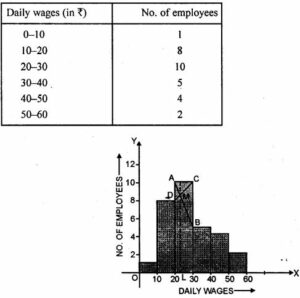
Taking daily wages on x-axis and No. of employees on the y-axis
and draw a histogram as shown. Join AB and CD intersecting each other at M.
From M draw ML perpendicular to x-axis, L is the mode
∴ Mode = Rs 23
Question 14. Draw a cumulative frequency curve for the following data :

Hence determine:
(i) the median
(ii) the pass marks if 85% of the students pass.
(iii) the marks which 45% of the students exceed.
Answer :
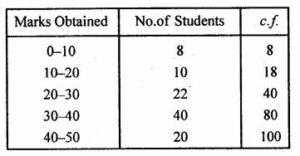
Plot the points (10, 8), (20, 18), (30, 40), (40, 80), and(50,100) on the graph.
Join the points with the free hand. An ogive as shown:
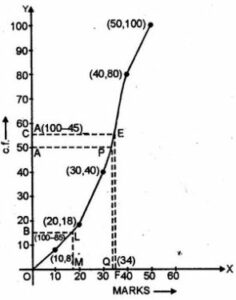
(i) Here number of observations, n = 100 which is even.
So median = ( n/2) th term
= (100/2) th term
= 50 th term
Mark a point A(50) on Y-axis. From A, draw a horizontal line parallel to X-axis meeting the curve at P.
From P, draw a line perpendicular to the x-axis which meets it at Q.
Q is the median .
Q = 32.5
Hence the median is 32.5 .
(ii) Total number of students = 100
85% of 100 = 85
Remaining number of students = 100-85 = 15
Mark a point B(15) on Y axis. From B, draw a horizontal line parallel to X-axis meeting the curve at L.
From L, draw a line perpendicular to the x-axis which meets it at M.
Here M = 18
The pass marks will be 18 if 85% of students passed.
(iii) Total number of students = 100
45% of 100 = 45
Remaining number of students = 100-45 = 55
Mark a point C(55) on Y axis. From C, draw a horizontal line parallel to X-axis meeting the curve at E. From E, draw a line perpendicular to the x-axis which meets it at F.
Here F = 34
–: End of ML Aggarwal Measures of Central Tendency Chapter Test Class 10 ICSE Maths Solutions :–
Return to :- ML Aggarwal Solutions for ICSE Class-10
Thanks
Please Share with Your Friends
