Data Handling Class-6 RS Aggarwal ICSE Maths Goyal Brothers Prakashan Chapter-24 Solutions. We provide step by step Solutions of Exercise / lesson-24 Data Handling of Plane Figure for ICSE Class-6 RS Aggarwal Maths.
Our Solutions contain all type Questions with Exe-24 with Notes on Data Handling of Plane Figure to develop skill and confidence. Visit official Website CISCE for detail information about ICSE Board Class-6 Mathematics.
| Board | ICSE |
| Publications | Goyal brothers Prakshan |
| Subject | Maths |
| Class | 6th |
| Chapter-24 | Data Handling |
| Writer | RS Aggrawal |
| Book Name | Foundation |
| Topics | Solution of Exe-24 |
| Academic Session | 2021-2022 |
Data Handling Class-6 RS Aggarwal ICSE Maths Goyal Brothers Prakashan Chapter-24 Solutions
Organised Data
- Data should be organised properly.
- This helps in extracting information.
Collection of numbers gathered together to give some valuable information is called data. Pictograph shows numerical information by making use of icons or picture symbols to represent data sets
What is the Bar graph?
A bar graph is also called a bar chart. It is used to represent data visually with the help of bars which are of different heights or lengths. The date graphed is either horizontally or vertically, to make it easy for the viewers to compare different values and therefore draw conclusions quickly.
The length of each bar represents the required information. Choosing an appropriate scale for a bar graph is important. Scale means the number used to represent one unit length of a bar
Introduction
Data is a collection of numbers gathered to give some information. To get particular information from the given data quickly, the data has to be organized first.
Data Handling
Data is a collection of numbers gathered to get some information. To get the required information, all observations should be recorded.
Tally marks are used to organize the observations. Record every observation by a vertical mark, but every fifth observation should be recorded by a mark across the four earlier marks
Pictograph
A picture that visually helps us to understand data is called a pictograph. A pictograph represents data in the form of pictures, objects or parts of objects.
In real life, pictographs are used by newspapers and magazines to attract the attention of the readers. A pictograph helps us to answer questions on the data at a glance. To draw pictographs, we use symbols to represent a certain number of things or items.
Exe-24
Data Handling Class-6 RS Aggarwal ICSE Maths Goyal Brothers Prakashan Chapter-24 Solution
Page 271
Question 1:
Arrange the following data in ascending order :
(i) 8, 3, 11, 15, 1, 7, 16, 25, 9, 4.
(ii) 5.7, 9.2, 3.1, 4.6, 1.8, 10.4, 2.5, 0.9, 1.2
Answer :
(i) 1, 3, 4, 7, 8, 9, 11, 15, 16, 25
(ii) 0.9, 1.2, 1.8, 2.5, 3.1, 4.6, 5.7, 9.2, 10.4
Question 2:
Arrange the following data in descending order :
(i) 15, 3, 0, 11, 7, 2, 23, 14, 29, 5, 1, 17.
(ii) 2.3, 4.6, 1.2, 0.4, 3.5, 9.7, 6.1, 4.8, 0.8, 1.0
Answer :
(i) 29, 23, 17, 15, 14, 11, 7, 5, 3, 2, 1, 0.
(ii) 9.7, 6.1, 4.8, 4.6, 3.5, 2.3, 1.2, 1.0, 0.8, 0.4.
Question 3:
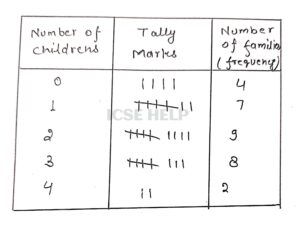
The number of children in 30 families of a colony are given below :
1, 2, 0, 3, 3, 2, 2, 1, 1, 1, 0, 0, 2, 3, 4, 1, 2, 3, 3, 0, 4, 2, 2, 3, 3, 1, 1, 2, 2, 3
Represent the above data in the form of the frequency table.
Answer :
The given data in ascending order we get :
0, 0, 0, 0, 1, 1, 1, 1, 1, 1, 1, 2, 2, 2, 2, 2, 2, 2, 2, 2, 3, 3, 3, 3, 3, 3, 3, 3, 4, 4
Question 4:
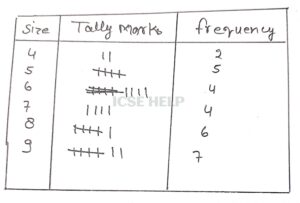
The sale of shoes of various sizes at a shop on a particular day is given below :
6, 9, 8, 5, 5, 4, 9, 8, 5, 6, 9, 9, 7, 8, 9, 7, 6, 9, 8, 6, 7, 5, 8, 9, 4, 5, 8, 7
Represent the above data in the form of the frequency table.
Answer :
The given frequency distribution table of the given data :
Question 5:
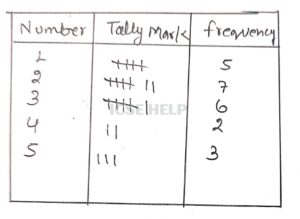
Construct a frequency table for the following :
3, 2, 1, 3, 5, 4, 3, 2, 2, 1, 1, 2, 1, 3, 5, 2, 2, 3, 1, 4, 5, 2, 3
Answer :
The given frequency distribution table of the given data :
Question 6:
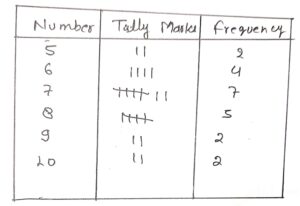
Construct a frequency table for the following :
6, 7, 8, 7, 5, 10, 9, 8,8, 7, 6, 7, 10, 8, 9, 7, 7, 6, 5, 6, 8, 7
Answer :
The given frequency distribution table of the given data :
–: End of Data Handling Class-6 RS Aggarwal Solutions :–
Return to- RS Aggarwal Solutions for ICSE Class-6 Goyal Brothers Prakashan
Thanks


