Data Handling Class-7 RS Aggarwal ICSE Maths Goyal Brothers Prakashan Chapter-24 Solutions. We provide step by step Solutions of Exercise / lesson-24 Data Handling for ICSE Class-7 RS Aggarwal Mathematics.
Our Solutions contain all type Questions with Exe-24 A, Exe-24 B, Exe-24 C, Exe-24 D, MCQs Exe-24 E with Mental Maths to develop skill and confidence. Visit official Website CISCE for detail information about ICSE Board Class-7 Mathematics.
| Board | ICSE |
| Publications | Goyal brothers Prakshan |
| Subject | Maths |
| Class | 7th |
| Chapter-24 | Data Handling |
| Writer | RS Aggrawal |
| Book Name | Foundation |
| Topics | Solution of Exe-24 A, Exe-24 B, Exe-24 C, Exe-24 D, MCQs Exe-24 E with Mental Maths to develop skill and confidence. |
| Academic Session | 2021-2022 |
Data Handling Class-7 RS Aggarwal ICSE Maths Goyal Brothers Prakashan Chapter-24 Solutions
-: Select Topic :-
Introduction to Statistics
– A study dealing with the collection, presentation and interpretation and analysis of data is called as statistics
Collection and Organisation of data in a particular manner makes it easier for us to understand and interpret data.
Average is a number that represents or shows the central tendency of a group of observations of data.
Data
- Facts /figures numerical or otherwise collected for a definite purpose is called as data.
- data collected first-hand data:- Primary
- Secondary data: Data collected from a source that already had data stored
Frequency
– The number of times a particular instance occurs is called frequency in statistics.
Ungrouped data
Grouped data
In grouped data, observations are organized in groups
Class Interval
- The size of the class into which a particular data is divided.
- E.g divisions on a histogram or bar graph.
- Class width = upper class limit – lower class limit
Regular and Irregular class interval
- Regular class interval: When the class intervals are equal or of the same sizes.
- E.g 0-10, 10-20, 20-30…..
- Irregular class interval: When the class intervals are of varying sizes.
- E.g 0-35, 35-45, 45-55,
Frequency table
– A frequency table or distribution shows the occurrence of a particular variable in a tabular form.
Sorting
- Raw data needs to be sorted in order to carry out operations.-
- Sorting ⇒ ascending order or descending order
Ungrouped frequency table
– When the frequency of each class interval is not arranged or organised in any manner
Grouped frequency table
– The frequencies of the corresponding class intervals are organised or arranged in a particular manner, either ascending or descending.
A bar graph is a representation of numbers using bars of uniform widths.
Mode of the data is the longest bar if the bar represents frequency.
Double bar graphs help to compare two collections of data at a glance.
Range
Range = Highest observation – Lowest observation
Mean
Mean always lies between the greatest and smallest observation of the data.
Range is the difference between the highest and the lowest observation of the data. i.e. Range = Highest observation – Lowest observation
Mode
Mode of a set of observation is the observation that occurs, the most often e.g. 2 is the mode of a set of numbers 1, 1, 2, 4, 3, 2, 1, 2, 2, 4.
Median
e.g. 24, 36,46,17,18, 25, 35 is given data.
Firstly, data is to arranged in ascending order i.e. 17,18, 24,25, 35,36, 46.
Since the median is the middle observation, therefore 25 is the median.
If the data has an odd number of items, then the median is the middle number.
If the data has an even number of items, then the median is mean of two middle numbers.
Exe-24 A,Mean
Class-7 RS Aggarwal ICSE Maths Goyal Brothers Prakashan
Page 275-276
Question 1:
Find the arithmetic mean of first five prime numbers.
Question 2:
mark obtained …………………… given below.
Question 3:
…………………..
…………………..
……………………
Question 13:
If the mean of the following frequency distribution is 15, find the value of p.
…………………
Exe-24 B,Median
Class-7 RS Aggarwal ICSE Maths Goyal Brothers Prakashan
Page 279-280
Question 1:
Find the median of :
(i) 72, ……………
(ii) 25, 18, …………..
Question 2:
……………………
……………………
…………………….
Question 8:
The height (in cm) of 35 student of a class are given below :
……………….
Find the median height.
Exe-24 C, Mode
Class-7 RS Aggarwal ICSE Maths Goyal Brothers Prakashan
Page 281-282
Question 1:
Find the mode of each of the following data :
(i)…………….
(ii)……………
Question 2:
A shoe store sells pairs of ………………… modal shoe size ?
Question 3:
…………………….
…………………….
…………………….
Question 5:
The following table gives the weight of 30 boxes of fruits :
……………..
Calculate its mode.
Graph Exe-24 D,
Class-7 RS Aggarwal ICSE Maths Goyal Brothers Prakashan
Page 286-288
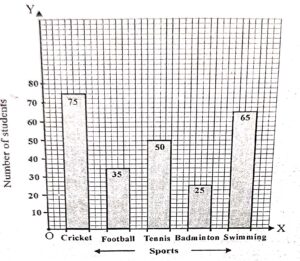
Question 1:
The following table shows the favourite sports of 250 student in school.
| Sports | Cricket | Football | Tannish | Badminton | Swimming |
| No. of students | 75 | 35 | 50 | 25 | 65 |
Represent the above data by the Colum graph.
Answer :
Taking the sport along x-axis and number of student along y-axis the required column-graph is given alongside:


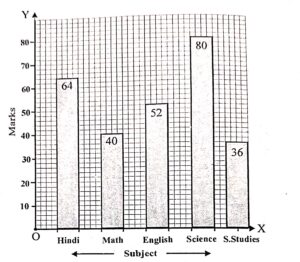
Question 2:
The marked obtained by a student in his annual examination in various subjects are given below :
| Subject | Hindi | Mathematics | English | Science | S.Studies |
| Marks | 64 | 40 | 52 | 80 | 36 |
Represent the above data by a bar graph.
Answer :
A bar graph given alongside :
We have represent subject along x-axis and marks along y-axis.
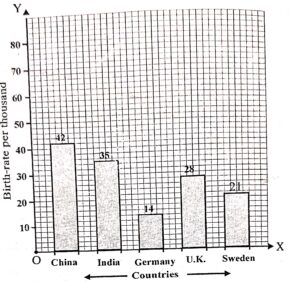
Question 3:
The birth-rate per thousand of five countries over a period of time is shown below :
| Country | China | India | Germany | U.K. | Sweden |
| Birth-rate per thousand | 42 | 35 | 14 | 28 | 21 |
Represent the above data by a bar graph.
Answer :
Taking the name of the country along x-axis and birth-rate per thousand along y-axis the required bar-graph is as shown below :
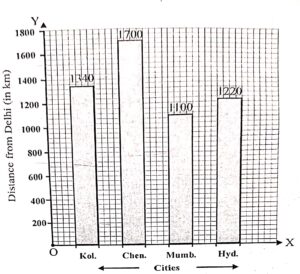
Question 4:
The air distance of four cities from Delhi (in km) are given below :
| City | Kolkata | Chennai | Mumbai | Hyderabad |
| Distance | 1340 | 1700 | 1100 | 1220 |
Draw a bar graph Represent the above data .
Answer :
We present cities along x-axis and distance from Delhi along y-axis the required bar-graph is as shown below :
Question 5:
Read the given bar graph and answer the question that follows :
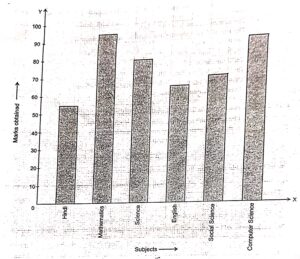
(i) What information is represented by the bar graph ?
(ii) How many marks were obtained in English ?
(iii) In which subject least marks were obtained ?
(iv) What was the total marks obtained in all the subjects together ?
Answer :
(i) Marks obtained by a student in various subjects in an examination.
(ii) Marks obtained in English are 65.
(iii) Least marks obtained are in Hindi.
(iv) 55 + 95 + 80 + 65 + 70 +90 = 455 marks
Question 6:
Read the bar graph given below :
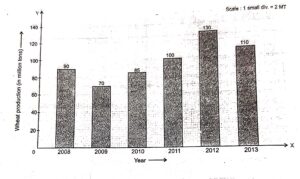
Answer the following questions :
(i) What information is given by the bar graph ?
(ii) What was the wheat production in 2010 ?
(iii) In which year the production was minimum ?
(iv) In which year there was maximum increase in production of wheat ?
(v) Find the percentage increase in wheat production in the year 2012.
Answer :
(i) Quantity of wheat produced (in millions tons, Le., in M1) by a state in various years from 2008 to 2013.
(ii) The production of wheat in 2010 was 85 MT.
(iii) 2009 Le. 70 MT
(iv) The production of wheat was maximum in the year 2012 ex. 130 MT
(v) The increase in wheat production for the year 2011 and 2012 = (130- 100) = 30 MT
Percentage increase = (30/100)x100
= 30 %
MCQs Exe-24 E,
Data Handling Class-7 RS Aggarwal ICSE Maths Goyal Brothers Prakashan
Page 288-
Choose the correct option in each of the following
Question 1:
The rang of the data ………………. 43
……………..
Answer :
Smallest terms = 5 and largest term = 56
Range = Largest terms – Smallest terms = 56 – 5
= 51
Option c is correct
Question 2:
The mean …………….. is equal to
Answer :
Option (d) is correct
Question 3:
For n ……………. observation .
Answer :
Median of n terms when n is odd{(n+1)/2}th terms
Option b is correct.
Question 4:
The Empirical formula …… mode is
……………
Answer :
Mode = 3 median -2 mean
Option b is correct
Question 5:
The median ………….. numbers is .
Answer :
Option c is correct.
Mental Maths
Data Handling Class-7 RS Aggarwal ICSE Maths Goyal Brothers Prakashan
Page 289
Question 1:
Fill in the blanks :
(i)…………
………….
Answer :
(i) Data
(ii) raw or ungrouped
(iii) variate
(iv) array
(v) range
(vi) frequency
(vii) frequency distribution
(viii) number of observation.
(ix) middle-most
(x) mode.
Question 2:
Write true or False :
(i)…………
………….
Answer :
(i) True
(ii) False
(iii) False
(iv) True
(v) True
–: End of Data Handling Class-7 RS Aggarwal Solutions :–
Return to- RS Aggarwal Solutions for ICSE Class-7 Goyal Brothers Prakashan
Thanks