Data Handling ICSE Class-6th Concise Selina Mathematics Solutions Chapter-33 (Including Pictograph and Bar Graph). We provide step by step Solutions of Exercise / lesson-33 Data Handling (Including Pictograph and Bar Graph)for ICSE Class-6 Concise Selina Mathematics.
Our Solutions contain all type Questions of Exe-33 A , Exe-33 B and Exe-33 C with Notes on “Data Handling” to develop skill and confidence. Visit official Website CISCE for detail information about ICSE Board Class-6 Mathematics .
Data Handling ICSE Class-6th Concise Selina Mathematics Solutions Chapter-33 (Including Pictograph and Bar Graph)
–: Select Topics :–
Notes
The word statistics is used for two different meanings.
In the singular sense, it is used as a science or a subject which deals with the collection, classification, tabulation, representation and interpretation of the data.
In the plural sense, it is sometimes used for the numerical facts collected in the form of numbers.
important term on Data Handling
1. Data : Each number, collected for giving a required information, is called the data.
2. Bar Graph (Column Graph) : Bar graph is the simplest form of presenting a data. It consists of bars (usually vertical), all of same widths. The heights of these bars are drawn according to the number they represent.
3. Pie Graph : When the given data is represented by the sectors of a circle, the resulting diagram (graph) obtained is called a pie-graph or a pie-chart.
Exercise – 33 (A), Data Handling (Including Pictograph and Bar Graph) for ICSE Class-6th Concise Selina Mathematics Solutions
Question- 1.
Marks scored by 30 students of class VI are as given below :
38, 46, 33, 45, 63, 53, 40, 85, 52, 75, 60, 73, 62, 22, 69, 43, 45, 33, 47, 41, 29, 43, 37, 49, 83, 44, 55, 22, 35 and 45. State :
(i) the highest marks scored.
(ii) the lowest marks scored.
(iii) the range of marks.
Answer-1
(i) Highest marks scored = 85 .
(ii) Lowest marks scored = 22
(iii) Range of marks = 85 – 22 = 63
Question -2.
For the following raw data, form a discrete frequency distribution :
30,32,32, 28,34,34,32,30,30,32,32,34,30,32,32. 28,32,30, 28,30,32,32,30,28 and 30.
Answer-2
The required frequency table will be as shown below:
| Marks | Tally-marks | Frequency |
| 28 | |||| | 4 |
| 30 | !∣|∣| ||| | 8 |
| 32 | !∣|∣| !∣|∣| | 10 |
| 34 | ||| | 3 |
| Total | 25 |
Question- 3.
Define :
(i) data
(ii) frequency of an observation.
Answer-3
(i) Data : The word data means information in the form of numerical figures.
(ii) Frequency of an observation : The number of times a particular observation occurs is called its frequency
Question- 4.
Re arrange the following raw data in descending order :
5.3, 5.2, 5.1, 5.7, 5.6, 6.0, 5.5, 5.9, 5.8, 6.1, 5.5, 5.8, 5.7, 5.9 and 5.4. Then write the :
(i) highest value
(ii) lowest value
(iii) range of values
Answer-4
Writing these numbers in descending order we get:
6.1, 6.0, 5.9, 5.9, 5.8, 5.8, 5.7, 5.7, 5.6, 5.5, 5.5, 5.4, 5.3, 5.2, 5.1
(i) Highest value = 6.1
(ii) Lowest value = 5.1
(iii) Range of values = Highest value – lowest value = 6.1 -5.1 = 1.0
Question-5
52, 56, 72, 68, 52, 68, 52, 68, 52, 60, 56, 72, 56, 60, 64, 56, 48, 48, 64 and 64.
Answer-5
The required frequency table will be as shown below:
| Marks | Tally – marks | Frequency |
| 48 | || | 2 |
| 52 | |||| | 4 |
| 56 | |||| | 4 |
| 60 | || | 2 |
| 64 | ||| | 3 |
| 68 | ||| | 3 |
| 72 | || | 2 |
| Total | 20 |
Question- 6.
In a study of number of accidents per day, the observations for 30 days were obtained as follows :
| 6 | 3 | 5 | 6 | 4 | 3 | 2 | 5 | 4 | 2 |
| 4 | 0 | 5 | 3 | 6 | 1 | 5 | 5 | 2 | 6 |
| 2 | 1 | 2 | 2 | 0 | 5 | 4 | 6 | 1 | 6 |
Construct a suitable frequency distribution table
Answer-6
The required frequency table will be as shown below:
| No. of. accidents | Tally marks | Frequency |
| 0 | || | 2 |
| 1 | ||| | 3 |
| 2 | |||| | | 6 |
| 3 | ||| | 3 |
| 4 | |||| | 4 |
| 5 | |||| | | 6 |
| 6 | |||| | | 6 |
| Total | 30 |
Question- 7.
The following data represents the weekly wages (in ₹) of 15 workers in a factory : 900, 850, 800, 850, 800, 750, 950, 900, 950, 800, 750, 900, 750, 800 and 850.
Prepare a frequency distribution table. Now find,
(i) how many workers are getting less than ₹850 per week?
(ii) how many workers are getting more than ₹800 per week?
Answer-7
The required frequency table will be as shown below:
| Weekly wages in (₹) | Tally-marks | Frequency |
| 750 | ||| | 3 |
| 800 | |||| | 4 |
| 850 | ||| | 3 |
| 900 | ||| | 3 |
| 950 | || | 2 |
| Total no.of workers | 15 |
(i) Workers getting less than ₹850 per week
No. of workers getting ₹750 = 3 workers
No. of workers getting ₹800 = 4 works
∴ Workers getting less than ₹ 850 = 4 + 3 = 7 workers
(ii) Workers are getting more than ₹800 per week
No. of workers getting ₹850 = 3
No. of workers getting ₹900 = 3
No. of workers getting ₹950 = 2
∴ Workers getting more than ₹800 = 3 + 3 + 2 = 8 workers
Question-8
(i) How many numbers are less than 19?
(ii) How many numbers are more than 20?
(iii) Which of the numbers, given above, is occurring most frequently?
Answer-8
The required frequency table will be as shown below:
| Marks | Tally marks | Frequency |
| 9 | |||| | 5 |
| 12 | |||| | 4 |
| 17 | ||| | 3 |
| 18 | || | 2 |
| 19 | || | 2 |
| 20 | || | 2 |
| 25 | || | 2 |
| Total | 20 |
(i) There are 14 numbers are less than 19.
(ii) There are 2 numbers more than 20.
(iii) 9 is occurring most frequently i.e. 5 times.
Question -9.
Using the following data, construct a frequency distribution table : 46, 44, 42, 54, 52, 60, 50, 58, 56, 62, 50, 56, 54, 58 and 48.
Now answer the following :
(i) What is the range of the numbers?
(ii) How many numbers are greater than 50?
(iii) How many numbers are between 40 and 50?
Answer-9
| Marks | Tally marks | Frequency |
| 42 | | | 1 |
| 44 | | | 1 |
| 46 | | | 1 |
| 48 | | | 1 |
| 50 | || | 2 |
| 52 | | | 1 |
| 54 | || | 2 |
| 56 | || | 2 |
| 58 | || | 2 |
| 60 | | | 1 |
| 62 | | | 1 |
| Total | 15 |
(i) Range of numbers = Highest number – Lowest number
= 62 – 42 = 20
(ii) 9 numbers are greater than 50
(iii) 6 numbers are between 40 and 50
Data Handling Exe- 33 B for ICSE Class-6th Concise Selina Mathematics (Including Pictograph and Bar Graph)
Question -1.
The sale of vehicles, in a particular city, during the first six months of the year 2016 is shown below :
| Month | Jan | Feb | March | April | May | June |
| Number of vehicles sold | 3000 | 2500 | 4000 | 1000 | 1500 | 3500 |
Draw a pictograph to represent the above data.
Answer-1
| Month | Number of Vehicles sold |
| Jan | |
| Feb | |
| March | |
| April | |
| May | |
| June |
We have taken, = 500 vehicles sold
Question -2.
The following pictograph shows the number of cars sold by four dealers A, B, C and D in a city. Scale: ![]() = 50 cars
= 50 cars
| Dealer | Number of cars |
| A | |
| B | |
| C | |
| D |
Using the pictograph, drawn above, answer the following questions:
Answer-2
(i) Cars sold by dealer A = 6 x 50 = 300
Cars sold by dealer D = 4 x 5 = 200 ,
∴ A sold more cars than dealer D by = 300 – 200 = 100
∴A has sold 100 more cars than dealer D.
(ii) No. of cars = 23
Scale = 50 cars
∴Total no. of cars = 23 x 50 = 1150 cars Ans.
Question- 3.
The following pictograph shows the number of watches manufactured by a factory, in a particular weeks.
| Day | Number of watches |
| Monday |  |
| Tuesday | |
| Wednesday | |
| Thursday | |
| Friday | |
| Saturday | |
Scale: = 100 watches
Find
(i) on which day were the least number of watches manufactured?
(ii) total number of watches manufactured in the whole week?
Answer-3
(i) On Friday least no. of watches manufactured by = 100 x 5 = 500 watches
(ii) Total no. of watches manufactured in the whole week = 100 x 42.5 = 4250 watches
Question -4.
The number or animals in five villages are as follows :

Prepare a pictograph of these animals using one symbol to represent 20 animals.
Answer-4
| Villages | Number of animals |
| A | |
| B | |
| C | |
| D | |
| E |
Question -5.
The following pictograph shows different subject books which are kept in a school library.

Taking symbol of one book = 50 books, find :
(i) how many History books are there in the library ?
(ii) how many Science books are there in the library ?
(iii) which books are maximum in number ?
Answer-5
(i) There are 50 x 4 = 200 History books in the library.
(ii) There are 50 x 5.5 = 275 Science books in the library.
(iii) English books are maximum in number = 500 x 9 = 450 books.
Selina Solutions of Data Handling Exe-33 C for ICSE Class-6th Concise Mathematics
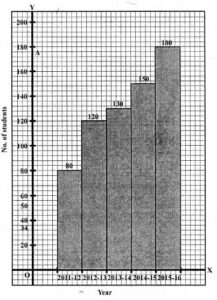
Question- 1.
The following table gives the number of students in class VI in a school during academic years 2011-2012 to 2015-2016.

Represent the above data by a bar graph.
Answer-1
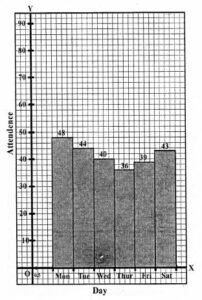
Question -2.
The attendance of a particular class for the six days of a week are as given below :

Draw a suitable graph.
Answer-2
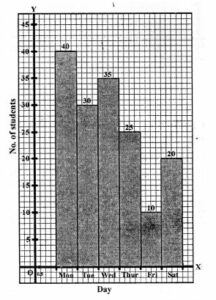
Question -3.
The total number of students present in class VI B, for the six days in a week were as given below. Draw a suitable bar graph.

Answer-3
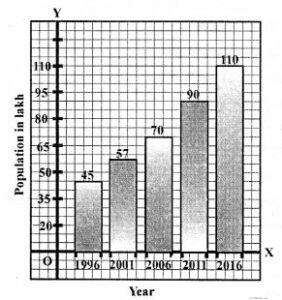
Question -4.
The following table shows the population of a particular city at different years :

Represent the above information with the help of a suitable bar graph.
Answer-4
Question -5.
In a survey of 300 families of a colony, the number of children in each family was recorded and the data has been represented by the bar graph, given below :

Read the graph carefully and answer the following questions :
(i) How many families have 2 children each?
(ii) How many families have no child?
(iii) What percentage of families have 4 children?
Answer-5
(i) 60 families have 2 children each.
(ii) Zero
(iii) The percentage of families having 4 children = 60⁄300 x 100 = 20%
Question- 6.
Use the data, given in the following table, to draw’ a bar graph

Out of A, B, C, D, E and F
(i) Which has the maximum value.
(ii) Which is greater A + D or B + E.
Answer-6
(i) D has the maximum value of 350
(ii) A + D = 250 + 350 = 600
B + E = 300 + 275 = 575
Hence A + D is greater.
Question -7.
The bar graph drawn below shows the number of tickets sold during a fair by 6 students A, B, C, D, E and F.

Using the Bar graph, answer the following questions :
(i) Who sold the least number of tickets?
(ii) Who sold the maximum number of tickets?
(iii) How many tickets were sold by A, B and C taken together?
(iv) How many tickets were sold by D, E and F taken together?
(v) What is the average number of tickets sold per student?
Answer-7
(i) Student D sold the least number of tickets, i.e. 7 tickets.
(ii) Student D sold the maximum number of tickets i.e. 24 tickets.
(iii) The tickets sold by A, B and C taken together
= Tickets sold by A + Tickets sold by B + Tickets sold by C
= 16 + 9 + 20 = 45 tickets
(iv) The tickets sold by D, E and F taken together
= Tickets sold by D + Tickets sold by E + Tickets sold by F
= 7 + 24 + 14 = 45 tickets
(v) Average Number of tickets sold per student
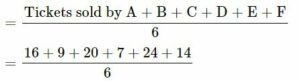
= 90⁄6
= 15 Tickets
Question -8.
The following bar graph shows the number of children, in various classes, in a school in Delhi.

Using the given bar graph, find :
(i) the number of children in each class.
(ii) the total number of children from Class 6 to Class 8.
(iii) how many more children there are in Class 5 compared to Class 6 ?
(iv) the total number of children from Class 1 to Class 8.
(v) the average number of children in a class.
Answer-8
(i) In, Class 1 = 100, Class 2 = 90, Class 3 = 100, Class 4 = 80,
Class 5 = 120, Class 6 = 90, Class 7 = 70, Class 8 = 50
(ii) Class 6 = 90, Class 7 = 70, Class 8 = 50, Total number = 210
(iii) Number of student in class 5 = 120, Number of student in class 6 = 90
More children is class 5 = (120 – 90) = 30
(iv) Total number of children class 1 to 8 = 100 + 90+ 100+ 80 + 120 +90 + 70 + 50 = 700
![]()
Question- 9.
The column graph, given above, shows the number of patients, examined by Dr. V.K. Bansal, on different days of a particular week.
Use the graph to answer the following:
(i) On which day were the maximum number of patients examined?
(ii) On which day were the least number of patients examined?
(iii) On which days were an equal number or patients examined?
(iv) What is the total number of patients examined in the week?
Answer-9
(i) Tuesday were the maximum number of patients examined.
(ii) Friday were the least number of patients examined.
(iii) Sunday and Thursday were equal number of patient examined.
(iv) Total number of patients examined in the week .
= 50 + 40 + 70 + 60 + 50 + 30 = 300
Question- 10.
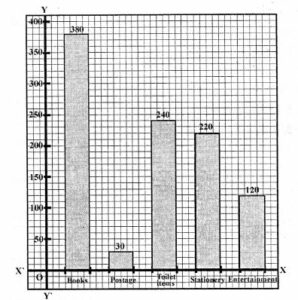
A student spends his pocket money on various items, as given below :
Books : Rs. 380, Postage : Rs. 30, Cosmetics : Rs. 240, Stationary : Rs. 220 and Entertainment: Rs. 120.
Draw a bar graph to represent his expenses.
Answer-10
Amount spent on
Books = Rs. 380
Postage = Rs. 30
Cosmetics = Rs. 240
Stationary = Rs. 220
Entertainment = Rs. 120
The bar graph of the above given data is below.
–: End of Data Handling ICSE Class-6th Concise Solutions :–
Return to – Concise Selina Maths Solutions for ICSE Class -6
Thanks


