ML Aggarwal Coordinate Geometry Exe-19.2 Class 9 ICSE Maths APC Understanding Solutions. Solutions of Exe-19.2. This post is the Solutions of ML Aggarwal Chapter 19 – Coordinate Geometry for ICSE Maths Class-9. APC Understanding ML Aggarwal Solutions (APC) Avichal Publication Solutions of Chapter-19 Coordinate Geometry for ICSE Board Class-9. Visit official website CISCE for detail information about ICSE Board Class-9.
ML Aggarwal Coordinate Geometry Exe-19.2 Class 9 ICSE Maths Solutions
| Board | ICSE |
| Publications | Avichal Publishig Company (APC) |
| Subject | Maths |
| Class | 9th |
| Chapter-19 | Coordinate Geometry |
| Writer | ML Aggarwal |
| Book Name | Understanding |
| Topics | Solution of Exe-19.2 Questions |
| Edition | 2021-2022 |
Exe-19.2 Solutions of ML Aggarwal for ICSE Class-9 Ch-19, Coordinate Geometry
Note:- Before viewing Solutions of Chapter – 19 Coordinate Geometry Class-9 of ML Aggarwal Solutions . Read the Chapter Carefully. Then solve all example given in Exercise-19.1, Exercise-19.2, Exercise-19.3, Exercise-19.4, MCQs, Chapter Test.
Coordinate Geometry Exercise-19.2
ML Aggarwal Class 9 ICSE Maths Solutions
Page 452
Question 1. Draw the graphs of the following linear equations :
(i) 2x + + 3 = 0
(ii) x- 5y- 4 = 0
Answer :
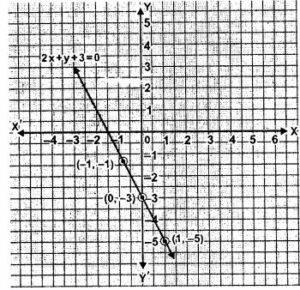
(i) 2x+y+3 = 0
y = -2x-3
When x = -1 ,
y = (-2×-1) -3 = 2-3 = -1
when x = 0,
y = (-2×0) -3 = 0-3 = -3
when x = 1,
y = (-2×1) -3 = -2-3 = -5
| x | -1 | 0 | 1 |
| y | -1 | -3 | -5 |
Plot the graph using the values (-1,-1), (0,-3),and (1,-5) as shown below.
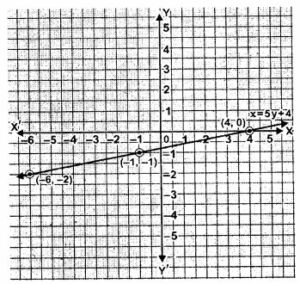
(ii) x-5y-4 = 0
x = 5y+4
When y = -2 ,
x = (5×-2) + 4 = -10+4 = -6
When y = -1 ,
x = (5×-1) + 4 = -5+4 = -1
When y = 0,
x = (5×0) + 4 = 0+4 = 4
| x | -6 | -1 | 4 |
| y | -2 | -1 | 0 |
Plot the graph using the values (-6,-2), (-1,-1),and (4,0) as shown below.
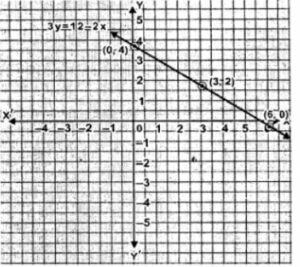
Question 2. Draw the graph of 3y= 12 – 2x. Take 2cm = 1 unit on both axes.
Answer :
3y = 12-2x
y = (12-2x)/3
when x = 0,
y = (12- 2×0)/3 = 12/3 = 4
when x = 3,
y = (12- 2×3)/3 = 6/3 = 2
when x = 6,
y = (12- 2×6)/3 = 0
| x | 0 | 3 | 6 |
| y | 4 | 2 | 0 |
Plot the graph using the values (0,4), (3,2) and (6,0) as shown below.
Question 3. Draw the graph of 5x + 6y – 30 = 0 and use it to find the area of the triangle formed by the line and the co-ordinate axes.
Answer :
5x+6y-30 = 0
⇒ 5x = 30-6y
⇒ x = (30-6y)/5
when y = 0,
x = (30- 6×0)/5 = 30/5 = 6
when y = 5,
x = (30- 6×5)/5 = 0
when y = 10,
x = (30-6×10)/5 = -30/5 = -6
| x | 6 | 0 | -6 |
| y | 0 | 5 | 10 |
Plot the graph using the values (6,0), (0,5) and (-6,10) as shown below.
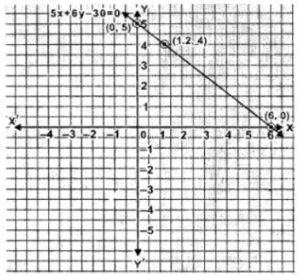
Area of the triangle formed by line and coordinate axes = ½ OA×OB
= ½ ×6×5
= 30/2
= 15 sq. units.
Hence,
area of the triangle is 15 sq. units.
Question 4. Draw the graph of 4x- 3y + 12 = 0 and use it to find the area of the triangle formed by the line and the co-ordinate axes. Take 2 cm = 1 unit on both axes.
Answer :
4x-3y+12 = 0
⇒ 4x = 3y-12
⇒ x = (3y-12)/4
when y = 0,
x = (3×0 -12)/4 = -12/4 = -3
when y = 2,
x = (3×2 -12)/4 = -6/4 = 1.5
when y = 4,
x = (3×4 -12)/4 = 0
| x | -3 | -1.5 | 0 |
| y | 0 | 2 | 4 |
Plot the graph using the values (-3,0), (-1.5,2),and (0,4) as shown below.
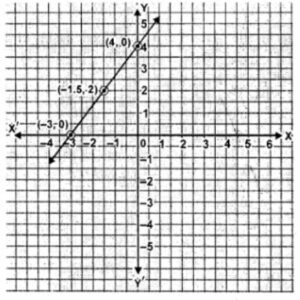
Area of the triangle formed by line and coordinate axes = ½ ǀOAǀ × ǀOBǀ
= ½ ×3×4
= 12/2
= 6 sq. units.
Hence,
area of the triangle is 6 sq. units.
Question 5. Draw the graph of the equation y = 3x – 4. Find graphically.
(i) the value of y when x = -1
(ii) the value of x when y = 5.
Answer :
y = 3x-4
when x = 0,
y = 3×0 -4 = 0-4 = -4
when x = 1,
y = 3×1 -4 = 3-4 = -1
when x = 2,
y = 3×2 -4 = 6-4 = 2
| x | 0 | 1 | 2 |
| y | -4 | -1 | 2 |
Plot the graph using the values (0, -4), (1, -1) and (2,2) as shown below.
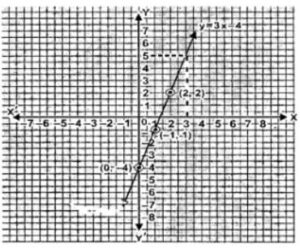
(i) x = -1
Draw a line parallel to Y axis from x = -1. It meets the graph at y = -7.
So when x = -1, the value of y is -7.
(ii) y = 5
Draw a line parallel to X axis from y = 5. It meets the graph at x = 3.
So when y = 5, the value of x is 3.
Question 6. The graph of a linear equation in x and y passes through (4, 0) and (0, 3). Find the value of k if the graph passes through (A, 1.5).
Answer :
points (4,0) and (0,3) on a graph.
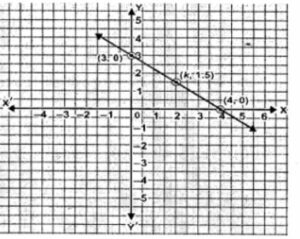
Mark A(k,1.5).
From the graph it is clear that the value of k is 2.
Question 7. Use the table given alongside to draw the graph of a straight line. Find, graphically the values of a and b.
| x | 1 | 2 | 3 | a |
| y | -2 | b | 4 | -5 |
Answer :
Plot the points (1,-2), (2,b), (3,4) and (a,-5) on the graph.
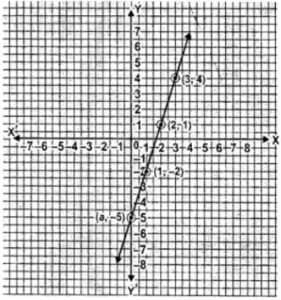
From the graph, it is clear that value of a is 0 and b is 1.
Hence,
a = 0 and b = 1.
— : End of ML Aggarwal Coordinate Geometry Exe-19.2 Class 9 ICSE Maths Solutions :–
Return to :- ML Aggarawal Maths Solutions for ICSE Class-9
Thanks
Please Share with Your Friends
Thank you so much for the answers