ML Aggarwal Statistics Exe-20.2 Class 9 ICSE Maths APC Understanding Solutions. Solutions of Exe-20.2. This post is the Solutions of ML Aggarwal Chapter 20 – Statistics for ICSE Maths Class-9. APC Understanding ML Aggarwal Solutions (APC) Avichal Publication Solutions of Chapter – 20 Statistics for ICSE Board Class-9. Visit official website CISCE for detail information about ICSE Board Class-9.
ML Aggarwal Statistics Exe-20.2 Class 9 ICSE Maths Solutions
| Board | ICSE |
| Publications | Avichal Publishig Company (APC) |
| Subject | Maths |
| Class | 9th |
| Chapter-20 | Statistics |
| Writer | ML Aggarwal |
| Book Name | Understanding |
| Topics | Solution of Exe-20.2 Questions |
| Edition | 2021-2022 |
Exe-20.2 Solutions of ML Aggarwal for ICSE Class-9 Ch-20, Statistics
Note:- Before viewing Solutions of Chapter – 20 Statistics Class-9 of ML Aggarwal Solutions . Read the Chapter Carefully. Then solve all example given in Exercise-20.1, Exercise-20.2, Exercise-20.3, MCQs, Chapter Test.
Statistics Exercise-20.2
ML Aggarwal Class 9 ICSE Maths Solutions
Page 484
Question 1. State which of the following variables are continuous and which are discrete:
(i)marks scored (out of 50) in a test.
(ii) daily temperature of your city.
(iii) sizes of shoes.
(iv)distance travelled by a man.
(v)time.
Answer :
(i) Discrete
(ii) Continuous
(iii) Discrete
(iv) Continuous
(v) Continuous
Question 2. Using class intervals 0-4, 5 -9, 10-14, …. construct the frequency distribution for the following data :
13, 6, 10, 5, 11, 14, 2, 8, 15, 16, 9, 13, 17, 11, 19, 5, 7, 12, 20, 21, 18, 1, 8, 12, 18.
Answer :
The frequency distribution for the following data is
| Class | Tally marks | Frequency |
| 0-4 | II | 2 |
| 5-9 | 7 | |
| 10-14 | 8 | |
| 15-19 | 6 | |
| 20-24 | II | 2 |
Question 3. Given below are the marks obtained by 27 students in a test:
21, 3, 28, 38, 6, 40, 20, 26, 9, 8, 14, 18, 20, 16, 17, 10, 8, 5, 22, 27, 34, 2, 35, 31, 16, 28, 37.
(i) Using the class intervals 1-10, 11-20 etc. construct a frequency table.
(ii) State the range of these marks.
(iii) State the class mark of the third class of your frequency table.
Answer:
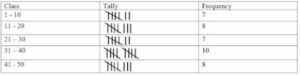
(i) The frequency table :
| Class | Tally marks | Frequency |
| 1-10 | 7 | |
| 11-20 | 8 | |
| 21-30 | 6 | |
| 31-40 | 6 |
(ii) Range of these marks is 38.
(iii) The class mark of the third class of your frequency table = (21 + 30)/ 2 = 25.5
Statistics Exercise-20.2
ML Aggarwal Class 9 ICSE Maths Solutions
Page 485
Question 4. A Explain the meaning of the following terms :
(i) variate
(ii) class size
(iii) class mark
(iv) class limits
(v) true class limits
(vi) frequency of a class
(vii) cumulative frequency of a class.
Answer:
(i) Variant: A particular value of a variable is called variate.
(ii) Class size: The difference between the actual upper limit and the actual lower limit of a class is called its class size.
(iii) Class mark: The class mark of a class is the value midway between its actual lower limit and actual upper limit.
(iv) Class limits: In the frequency table the class interval is called class limits.
(v) True class limits: In a continuous distribution, the class limits are called true or actual class limits.
(vi) Frequency of a class: The number of tally marks opposite to a variate is its frequency and it is written in the next column opposite to tally marks of the variate.
(vii) Cumulative frequency of a class: The sum of frequency of all previous classes and that particular class is called the cumulative frequency of the class.
Question 5. Fill in the blanks :
(i) The number of observations in a particular class is called ……of the class.
(ii) The difference between the class marks of two consecutive classes is the
of the class.
(iii) The range of the data 16, 19, 23, 13, 11, 25, 18 is.. .
(iv) The mid-point of the class interval is called its …
(v) The class mark of the class 4 – 9 is ….
Answer:
(i) The number of observations in a particular class is called frequency of the class.
(ii) The difference between the class marks of two consecutive classes is the size of the class.
(iii) The range of the data 16, 19, 23, 13, 11, 25, 18 is 14.
(iv) The mid-point of the class interval is called its class marks.
(v) The class mark of the class 4 – 9 is 6.5. [Class mark = (4 + 9)/2 = 13/2 = 6.5]
Question 6. The marks obtained (out of 50) by 40 students in a test are given below:
28, 31, 45, 03, 05, 18, 35, 46, 49, 17, 10, 28, 31, 36, 40, 44, 47, 13, 19, 25, 24, 31, 38, 32,
27, 19, 25, 28, 48, 15, 18, 31, 37, 46, 06, 01, 20, 10, 45, 02.
(i) Taking class intervals 1- 10, 11 – 20, .., construct a tally chart and a frequency
distribution table.
at
(ii) Convert the above distribution to continuous distribution.
(iii) State the true class limits of the third class.
(iv) State the class mark of the fourth class.
Answer:
(i) A tally chart and a frequency distribution :
(ii) Converting the above distribution to continuous distribution.
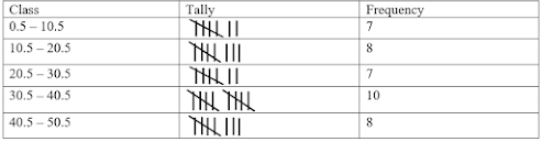
(iii) The true class limits of the third class=lower limit = 20.5 and upper limit = 30.5
(iv) The class mark of the fourth class (31 + 40)/2 = 71/2 = 35.5
Question 7. Use the adjoining table to find:
(i) upper and lower limits of fifth class.
(ii) true class limits of the fifth class.
(iii) class boundaries of the third class.
(iv) class mark of the fourth class.
| Class | Frequency |
| 28-32 | 5 |
| 33-37 | 8 |
| 38-42 | 13 |
| 43-47 | 9 |
| 48-52 | 7 |
| 53-57 | 5 |
| 58-62 | 2 |
Answer:
(i) Upper and lower limits of fifth class are as follows.
Upper limit = 52 and lower limit = 48
(ii) True class limits of the fifth class
Upper limit = 52.5 and lower limit = 47.5
(iii) Class boundaries of the third class is 37.5 and 42.5.
(iv) Class mark of the fourth class = (43 + 47)/2 = 90/2 = 45
(v) Width of sixth class=57.5 – 52.5 = 5
Question 8. The marks of 200 students in a test were recorded as follows:
| Marks % | 10-19 | 20-29 | 30-39 | 40-49 | 50-59 | 60-69 | 70-79 | 80-89 |
| No. of students | 7 | 11 | 20 | 46 | 57 | 37 | 15 | 7 |
Answer:
The cumulative frequency table is as follows:
| Marks % (Class) | Frequency | Cumulative Frequency |
| 10-19 | 7 | 7 |
| 20-29 | 11 | 18 |
| 30-39 | 20 | 38 |
| 40-49 | 46 | 84 |
| 50-59 | 57 | 141 |
| 60-69 | 37 | 178 |
| 70-79 | 15 | 193 |
| 80-89 | 7 | 200 |
Question 9. Given below are the marks secured by 35 students in a test:
41, 32, 35, 21, 11, 47, 42, 00, 05, 18, 25, 24, 29, 38, 30, 04, 14, 24, 34, 44, 48, 33, 36, 38, 41, 46, 08, 34, 39, 11, 13, 27, 26, 43, 03.
Taking class intervals 0-10, 10– 20, 20 – 30.
frequency distribution table. Find the number of students obtaining below 20 marks
Answer:
The cumulative frequency distribution table:
| Class | Tally Marks | Frequency | Cumulative Frequency |
| 0-10 | 5 | 5 | |
| 10-20 | 5 | 10 | |
| 20-30 | 7 | 17 | |
| 30-40 | 10 | 27 | |
| 40-50 | 8 | 35 |
The number of students obtaining below 20 marks is 10.
Statistics Exercise-20.2
ML Aggarwal Class 9 ICSE Maths Solutions
Page 486
Question 10. The marks out of 100 of 50 students in a test are given below:
5 35 6 35 18 36 12 36 85 32
20 36 22 38 24 50 22 39 74 31
25 54 25 64 25 70 28 66 58 25
29 72 31 82 31 84 31 82 37 21
32 84 32 92 35 95 34 92 35 5
(i) Taking a class interval of size 10, construct a frequency as well as cumulative frequency table for the given data.
(ii) Which class has the largest frequency?
(iii) How many students score less than 40 marks?
(iv) How many students score first division (60% or more) marks?
Answer:
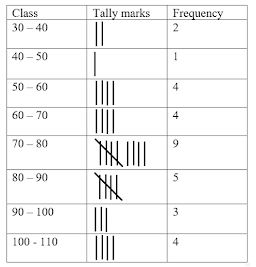
(i) The cumulative frequency table for the :
| Class | Tally marks | Frequency | Cumulative frequency |
| 0-10 | III | 3 | 3 |
| 10-20 | II | 2 | 5 |
| 20-30 | 11 | 16 | |
| 30-40 | 18 | 34 | |
| 40-50 | 18 | 34 | |
| 50-60 | III | 3 | 37 |
| 60-70 | II | 2 | 39 |
| 70-80 | III | 3 | 42 |
| 80-90 | 5 | 47 | |
| 90-100 | III | 3 | 50 |
(ii) 30-40 is the class which has the largest frequency.
(iii) 34 students score less than 40 marks.
(iv) 13 students score first division (60% or more) marks.
Question 11. Construct the frequency distribution table from the following data:
| Ages (in years) | Below 4 | Below 7 | Below 10 | Below 13 | Below 16 |
| No. of children | 7 | 38 | 175 | 248 | 300 |
State the number of children in the age group 10-13.
Answer:
The frequency distribution table from the given data:
| Class | Frequency |
| 0-4 | 7 |
| 4-7 | 31 |
| 7-10 | 137 |
| 10-13 | 73 |
| 13-16 | 52 |
Hence,
the number of children in the age group 10-13 is 73.
Question 12. Rewrite the following cumulative frequency distribution into frequency distribution:
Less than or equal to 10 2
Less than or equal to 20 7
Less than or equal to 30 18
Less than or equal to 40 32
Less than or equal to 50 43
Less than or equal to 60 50
Answer:
The given cumulative frequency distribution is rewritten into frequency distribution below:
| Class | Frequency |
| 0-10 | 2 |
| 11-20 | 5 |
| 21-30 | 11 |
| 31-40 | 14 |
| 41-50 | 11 |
| 51-60 | 7 |
Question 13. The water bills (in rupees) of 32 houses in a locality are given below. Construct a frequency distribution table with a class size of 10.
80, 48, 52, 78, 103, 85, 37, 94, 72, 73, 66, 52, 92, 85, 78, 81, 64, 60, 75, 78, 108, 63, 71, 54, 59, 75, 100, 103, 35, 89, 95, 73.
Answer:
A frequency distribution with a class size of 10 is follows:
Question 14. The maximum temperatures (in degree Celsius) for Delhi for the month of April, 2014, as reported by the Meteorological Department, are given below:
27.4, 28.3, 23.9, 23.6, 25.4, 27.5, 28.1, 28.4, 30.5, 29.7, 30.6, 31.7, 32.2, 32.6, 33.4, 35.7, 36.1, 37.2, 38.4, 40.1, 40.2, 40.5, 41.1, 42.0, 42.1, 42.3, 42.4, 42.9, 43.1, 43.2.
Construct a frequency distribution table.
Answer:
The frequency distribution table of the given data is as follows:
| Class | Tally marks | Frequency |
| 23.5-27.5 | IIII | 4 |
| 27.5-31.5 | 7 | |
| 31.5-35.5 | IIII | 4 |
| 35.5-39.5 | IIII | 4 |
| 39.5-43.5 | 11 |
Question 15.
(i) The class marks of a distribution are 94, 104, 114, 124, 134, 144 and 154. Determine the class size and the class limits of the fourth class.
(ii) The class marks of a distribution are 9.5, 16.5, 23.5, 30.5, 37.5 and 44.5. Determine the class size and the class limits of the third class.
Answer:
(i) Class size is the difference between two successive class marks
Class size = 104 – 94 = 10
Class limits of the fourth class
Lower limit = 119 and upper limit = 129
(ii) Class size is the difference between two successive class marks
Class size = 16.5 – 9.5 = 7
Class limits of the third class
Lower limit = 20 and upper limit = 27.
— : End of ML Aggarwal Statistics Exe-20.2 Class 9 ICSE Maths Solutions :–
Return to :- ML Aggarawal Maths Solutions for ICSE Class-9
Thanks
Please Share with Your Friend