ML Aggarwal Statistics Exe-20.3 Class 9 ICSE Maths APC Understanding Solutions. Solutions of Exe-20.3. This post is the Solutions of ML Aggarwal Chapter 20 – Statistics for ICSE Maths Class-9. APC Understanding ML Aggarwal Solutions (APC) Avichal Publication Solutions of Chapter – 20 Statistics for ICSE Board Class-9. Visit official website CISCE for detail information about ICSE Board Class-9.
ML Aggarwal Statistics Exe-20.3 Class 9 ICSE Maths Solutions
| Board | ICSE |
| Publications | Avichal Publishig Company (APC) |
| Subject | Maths |
| Class | 9th |
| Chapter-20 | Statistics |
| Writer | ML Aggarwal |
| Book Name | Understanding |
| Topics | Solution of Exe-20.3 Questions |
| Edition | 2021-2022 |
Exe-20.3 Solutions of ML Aggarwal for ICSE Class-9 Ch-20, Statistics
Note:- Before viewing Solutions of Chapter – 20 Statistics Class-9 of ML Aggarwal Solutions . Read the Chapter Carefully. Then solve all example given in Exercise-20.1, Exercise-20.2, Exercise-20.3, MCQs, Chapter Test.
Statistics Exercise-20.3
ML Aggarwal Class 9 ICSE Maths Solutions
Page 494
Question 1. The area under wheat cultivation last year in the following states, correct to the nearest lacs hectares was:
| State | Punjab | Haryana | U.P. | M.P. | Maharashtra | Rajasthan |
| Cultivated area | 220 | 120 | 100 | 40 | 80 | 30 |
Answer :
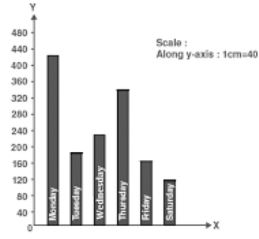
Question 2. The number of books sold by a shopkeeper in a certain week was as follows:
| Day | Monday | Tuesday | Wednesday | Thursday | Friday | Saturday |
| No. of books | 420 | 180 | 230 | 340 | 160 | 120 |
Answer :
Statistics Exercise-20.3
ML Aggarwal Class 9 ICSE Maths Solutions
Page 495
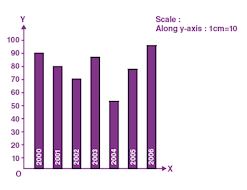
Question 3. Given below is the data of percentage of passes of a certain school in the ICSE for consecutive years:
| Year | 2000 | 2001 | 2002 | 2003 | 2004 | 2005 | 2006 |
| % of passes | 92 | 80 | 70 | 86 | 54 | 78 | 94 |
Answer :
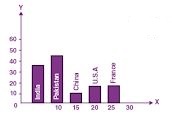
Question 4. Birth rate per thousand of different countries over a certain period is:
| Country | India | Pakistan | China | U.S.A. | France |
| Birth rate | 36 | 45 | 12 | 18 | 20 |
Answer :
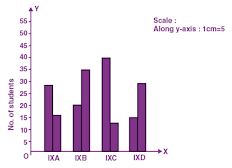
Question 5
Given below is the data of number of students (boys and girls) in class IX of a certain school:
| Class | IX A | IX B | IX C | IX D |
| Boys | 28 | 22 | 40 | 15 |
| Girls | 18 | 34 | 12 | 25 |
Draw a bar graph to represent the above data.
Answer 5
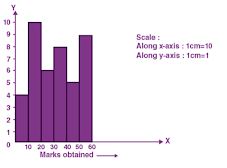
Question 6. Draw a histogram to represent the following data:
| Marks obtained | 0-10 | 10-20 | 20-30 | 30-40 | 40-50 | 50-60 |
| No. of students | 4 | 10 | 6 | 8 | 5 | 9 |
Answer :
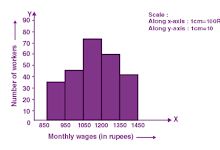
Question 7. Draw a histogram to represent the following frequency distribution of monthly wages of 255 workers of a factory.
| Monthly wages (in rupees) | 850-950 | 950-1050 | 1050-1150 | 1150-1250 | 1250-1350 |
| No. of workers | 35 | 45 | 75 | 60 | 40 |
Answer :
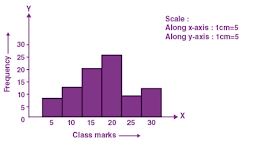
Question 8. Draw a histogram for the following data:
| Class marks | 12.5 | 17.5 | 22.5 | 27.5 | 32.5 | 37.5 |
| Frequency | 7 | 12 | 20 | 28 | 8 | 11 |
Answer :
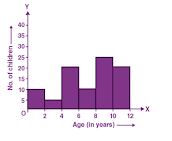
Question 9. Draw a histogram for the following frequency distribution:
| Age (in years) | Below 2 | Below 4 | Below 6 | Below 8 | Below 10 | Below 12 |
| No. of children | 12 | 15 | 36 | 45 | 72 | 90 |
Answer :
First convert the given cumulative frequency into frequency distribution table:
| Age (in years) | c.f. | f. |
| 0-2 | 12 | 12 |
| 2-4 | 15 | 3 |
| 4-6 | 36 | 21 |
| 6-8 | 45 | 9 |
| 8-10 | 72 | 27 |
| 10-12 | 90 | 18 |
represent age on x-axis and number of children on y-axis :
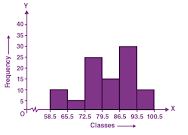
Question 10. Draw a histogram for the following data:
| Classes | 59-65 | 66-72 | 73-79 | 80-86 | 87-93 | 94-100 |
| Frequency | 10 | 5 | 25 | 15 | 30 | 10 |
Answer :
| Classes | Classes after adjustment | Frequency |
| 59-56 | 58.5-65.5 | 10 |
| 66-72 | 65.5-72.5 | 5 |
| 73-79 | 72.5-79.5 | 25 |
| 80-86 | 79.5-86.5 | 15 |
| 87-93 | 86.5-93.5 | 30 |
| 94-100 | 93.5-100.5 | 10 |
Represent classes on x-axis and frequency on y-axis :
Statistics Exercise-20.3
ML Aggarwal Class 9 ICSE Maths Solutions
Page 496
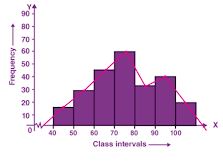
Question 11. Draw a frequency polygon for the following data:
| Class intervals | 40-50 | 50-60 | 60-70 | 70-80 | 80-90 | 90-100 |
| Frequency | 15 | 28 | 45 | 32 | 41 | 18 |
Answer :
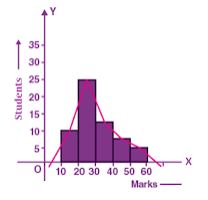
Question 12. In a class of 60 students, the marks obtained in a monthly test were as under:
| Marks | 10-20 | 20-30 | 30-40 | 40-50 | 50-60 |
| Students | 10 | 25 | 12 | 08 | 05 |
Answer :
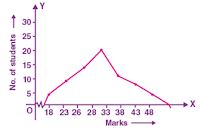
Question 13. In a class of 90 students, the marks obtained in a weekly test were as under:
| Marks | 16-20 | 21-25 | 26-30 | 31-25 | 36-40 | 41-45 | 46-50 |
| No. of students | 4 | 12 | 18 | 26 | 14 | 10 | 6 |
Answer :
| Marks | Classes after adjustment | Class Mark | No. of students (f) |
| 16-20 | 15.5-20.5 | 18.0 | 4 |
| 21-25 | 20.5-25.5 | 23.0 | 12 |
| 26-30 | 25.5-30.5 | 28.0 | 18 |
| 31-35 | 30.5-35.5 | 33.0 | 26 |
| 36-40 | 35.5-40.5 | 38.0 | 14 |
| 41-45 | 40.5-45.5 | 43.0 | 10 |
| 46-50 | 45.5-50.5 | 48.0 | 6 |
Represent marks on x-axis and frequency on y-axis :
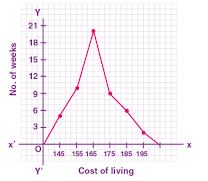
Question 14. In a city, the weekly observations made in a study on the cost of living index are given in the following table:
| Cost of living index | 140-150 | 150-160 | 160-170 | 170-180 | 180-190 | 190-200 |
| Number of weeks | 5 | 10 | 20 | 9 | 6 | 2 |
Answer :
| Cost of living index | No. of weeks | Mid-points |
| 140-150 | 5 | 145 |
| 150-160 | 10 | 155 |
| 160-170 | 20 | 165 |
| 170-180 | 9 | 175 |
| 180-190 | 6 | 185 |
| 190-200 | 2 | 195 |
Mark the mid-points of the cost of living index on x-axis and number of weeks on the y-axis:
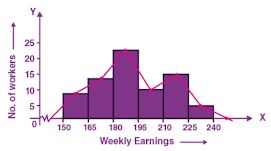
Question 15. Construct a combined histogram and frequency polygon for the following data:
| Weekly earnings (in rupees) | 150-165 | 165-180 | 180-195 | 195-210 | 210-225 | 225-240 |
| No. of workers | 8 | 14 | 22 | 12 | 15 | 6 |
Answer :
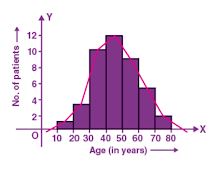
Question 16. In a study of diabetic patients, the following data was obtained:
| Age (in years) | 10-20 | 20-30 | 30-40 | 40-50 | 50-60 | 60-70 | 70-80 |
| No. of patients | 3 | 8 | 30 | 36 | 27 | 15 | 6 |
Represent the above data by a histogram and a frequency polygon.
Answer :
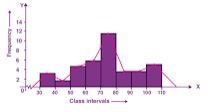
Question 17. The water bills (in rupees) of 32 houses in a locality are given below:
30, 48, 52, 78, 103, 85, 37, 94, 72, 73, 66, 52, 92, 65, 78, 81, 64, 60, 75, 78, 108, 63, 71, 54, 59, 75, 100, 103, 35, 89, 95, 73.
Taking class intervals 30-40, 40-50, 50-60, ….. ,form frequency distribution table. Construct a combined histogram and frequency polygon.
Answer :
| Class Intervals | Tally Marks | Frequency |
| 30-40 | III | 3 |
| 40-50 | I | 1 |
| 50-60 | IIII | 4 |
| 60-70 | 5 | |
| 70-80 | 9 | |
| 80-90 | III | 3 |
| 90-100 | III | 3 |
| 100-110 | IIII | 4 |
Take class intervals on x-axis and frequency on y-axis:
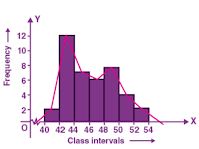
Question 18. The number of matchsticks in 40 boxes on counting was found as given below:
44, 41, 42, 43, 47, 50, 51, 49, 43, 42, 40, 42, 44, 45, 49, 42, 46, 49, 45, 49, 45, 47, 48, 43, 43, 44, 48, 43, 46, 50, 43, 52, 46, 49, 52, 51, 47, 43, 43, 45.
Taking classes 40-42, 42-44 ….., construct the frequency distribution table for the above data. Also draw a combined histogram and frequency polygon to represent the distribution.
Answer :
| Class Intervals | Tally Marks | Frequency |
| 40-42 | II | 2 |
| 42-44 | 12 | |
| 44-46 | 7 | |
| 46-48 | 6 | |
| 48-50 | 7 | |
| 50-52 | IIII | 4 |
| 52-54 | II | 2 |
| Total | 40 |
Take class on x-axis and frequency on y-axis :
Statistics Exercise-20.3
ML Aggarwal Class 9 ICSE Maths Solutions
Page 497
Question 19
The histogram showing the weekly wages (in rupees) of workers in a factory is given alongside.
Answer the following about the frequency distribution:
(i) What is the frequency of the class 400-425?
(ii) What is the class having minimum frequency?
(iii) What is the cumulative frequency of the class 425 – 450?
(iv) Construct a frequency and cumulative frequency table for the given distribution.
Answer :
(i) The frequency of the class 400-425 is 18.
(ii) The class having minimum frequency is 475-500.
(iii) The cumulative frequency of the class 425-450 is (6 + 18 + 10) = 34.
(iv) The frequency table for the given distribution is:
| Classes | Frequency | Cumulative Frequency |
| 375-400 | 6 | 6 |
| 400-425 | 18 | 24 |
| 425-450 | 10 | 34 |
| 450-475 | 20 | 54 |
| 475-500 | 4 | 58 |
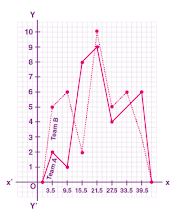
Question 20
The runs scored by two teams A and B on the first 42 balls in a cricket match are given below:
| No. of balls | 1-6 | 7-12 | 13-18 | 19-24 | 25-30 | 31-36 | 37-42 |
| Runs scored by Team A | 2 | 1 | 8 | 9 | 4 | 5 | 6 |
| Runs scored by Team B | 5 | 6 | 2 | 10 | 5 | 6 | 3 |
Answer :
| No. of balls | Class marks | Team A | Team B |
| 1-6 | 3.5 | 2 | 5 |
| 7-12 | 9.5 | 1 | 6 |
| 13-18 | 15.5 | 8 | 2 |
| 19-24 | 21.5 | 9 | 10 |
| 25-30 | 27.5 | 4 | 5 |
| 31-36 | 33.5 | 5 | 6 |
| 37-42 | 39.5 | 6 | 3 |
— : End of ML Aggarwal Statistics Exe-20.3 Class 9 ICSE Maths Solutions :–
Return to :- ML Aggarawal Maths Solutions for ICSE Class-9
Thanks
Please Share with Your Friend


2 thoughts on “ML Aggarwal Statistics Exe-20.3 Class 9 ICSE Maths Solutions”
G
Byju’s ka copy paste