Histogram and Ogive Class 10 OP Malhotra Exe-19C ICSE Maths Solutions Ch-19. Step by step solutions of questions as latest prescribe guideline for upcoming exam. In this article you would learn to Construct Ogive. Visit official Website CISCE for detail information about ICSE Board Class-10 Mathematics.
Histogram and Ogive Class 10 OP Malhotra Exe-19C ICSE Maths Solutions Ch-19
| Board | ICSE |
| Publications | S Chand |
| Subject | Maths |
| Class | 10th |
| Chapter-19 | Histogram and Ogive |
| Writer | OP Malhotra |
| Exe-19C | How to Construct Ogive |
| Edition | 2024-2025 |
How to Construct Ogive
An Ogive or Cumulative Frequency Curve is a curve of a data set obtained by an individual through the representation of cumulative frequency distribution on a graph. As there are two types of cumulative frequency distribution
the ogives are also of two types: 1. Less than Ogive 2. More than Ogive
Less than Ogive
The steps required to present a less than ogive graph are as follows:
- To present a less than ogive graph, add the frequencies of all the preceding class intervals to the frequency of a class.
- After that, plot the less than cumulative frequencies on the Y-axis against the upper limit of the corresponding class interval on the X-axis.
- n the last step, join these points by a smooth freehand curve, which is the resulting less than ogive.
More than Ogive
The steps required to present a more than ogive graph are as follows:
- To present a more than ogive graph, add the frequencies of all the succeeding class intervals to the frequency of a class.
- After that, plot the more than cumulative frequencies on the Y-axis against the upper limit of the corresponding class interval on the X-axis.
- In the last step, join these points by a smooth freehand curve, which is the resulting more than ogive.
Exercise- 19C Ogive
Histogram and Ogive Class 10 OP Malhotra ICSE Maths Solutions Ch-19
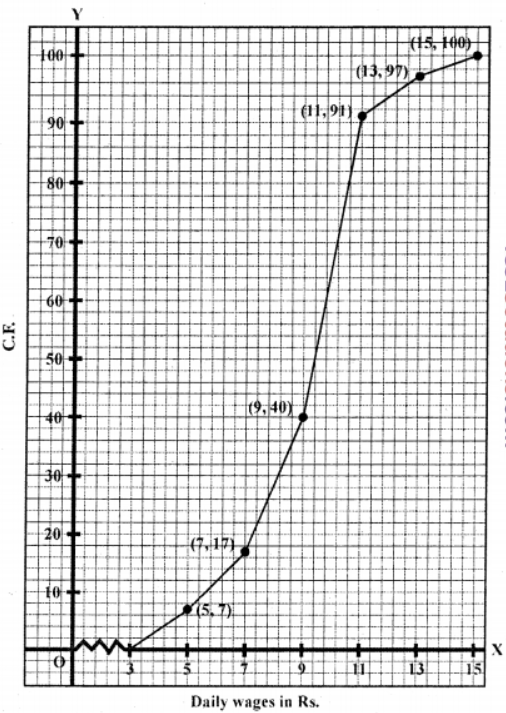
Que-1: The daily wages of casual labour employed by a group of limited concerns are given below:
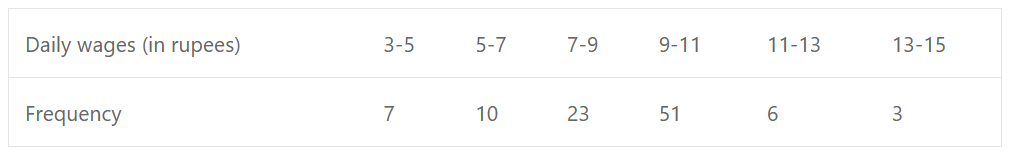
Sol:
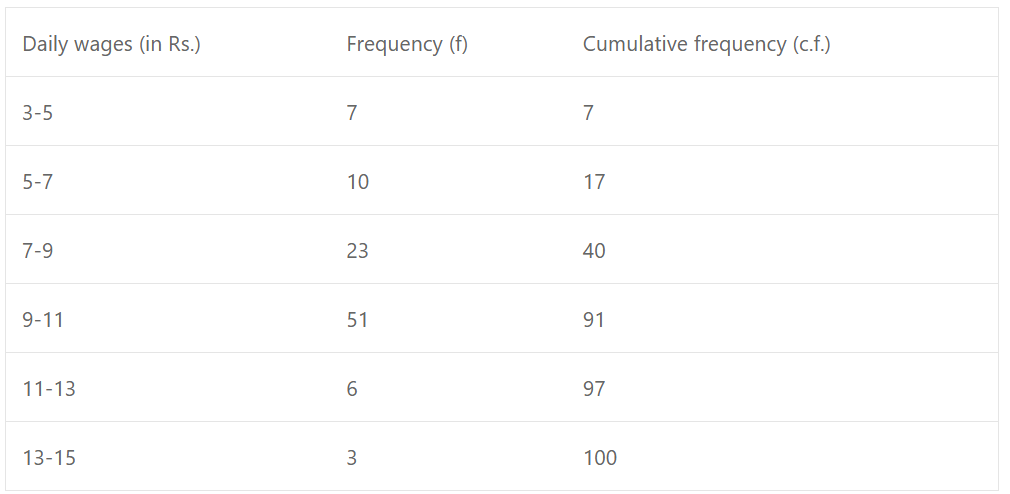
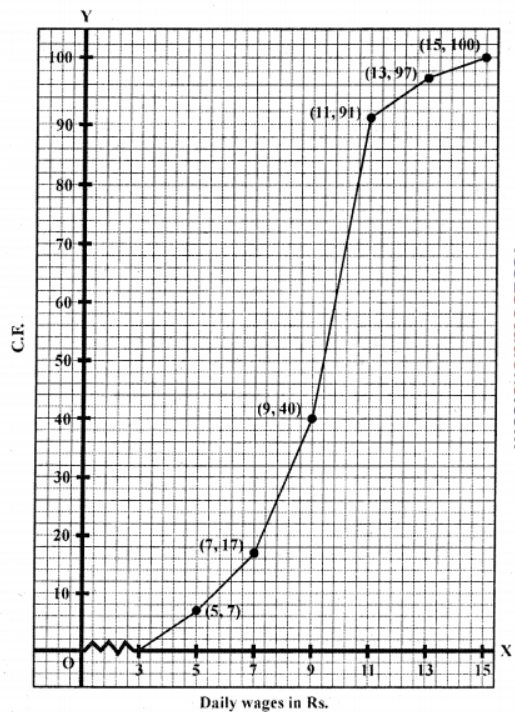
Now we shall plot the points (5, 7), (7, 17), (9, 40), (11, 91), (13, 97), and (15, 100) on the graph and join them with free hand to get an ogive as shown.
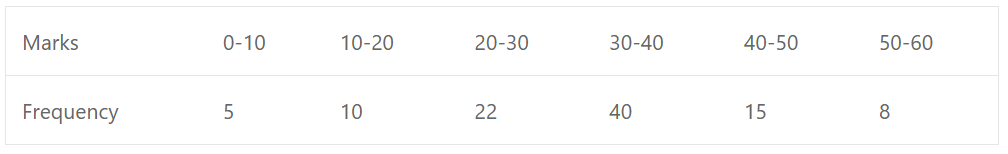
Que-2: Draw a cumulative frequency curve for the following data :
(a)
(b)
(c)
Sol: (a)
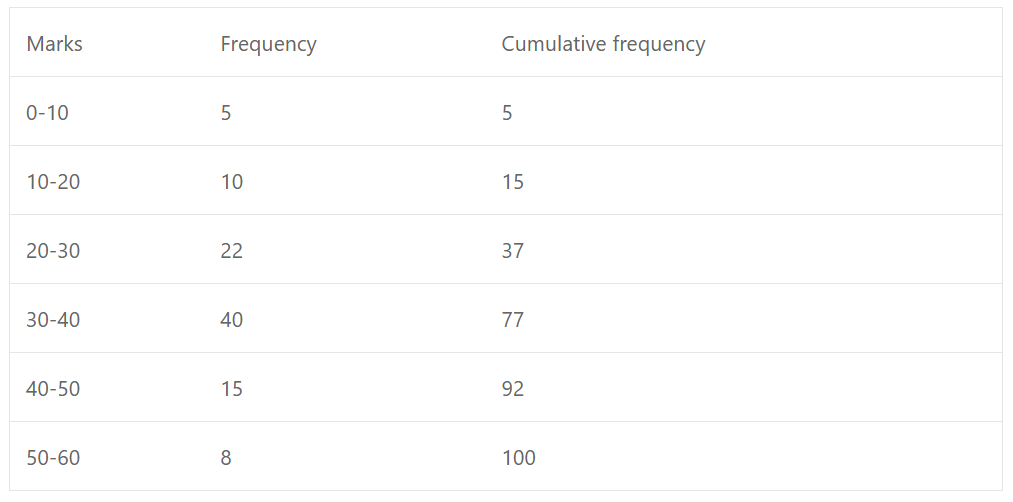
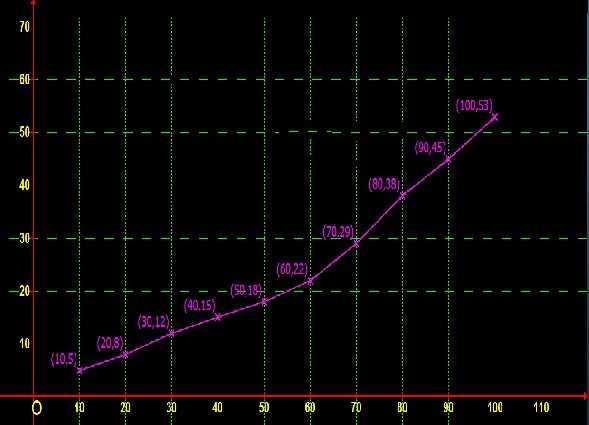
Now we shall plot the points (10, 5), (20, 15), (30, 37), (40, 77), (50, 92) and (60, 100) and join them with free hand to get an ogive as shown.
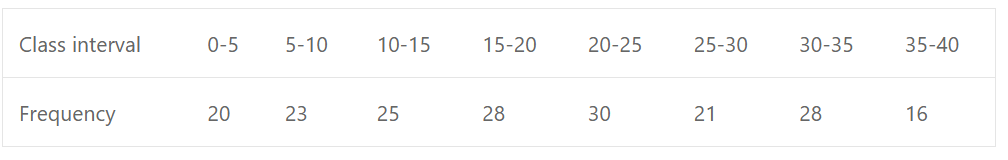
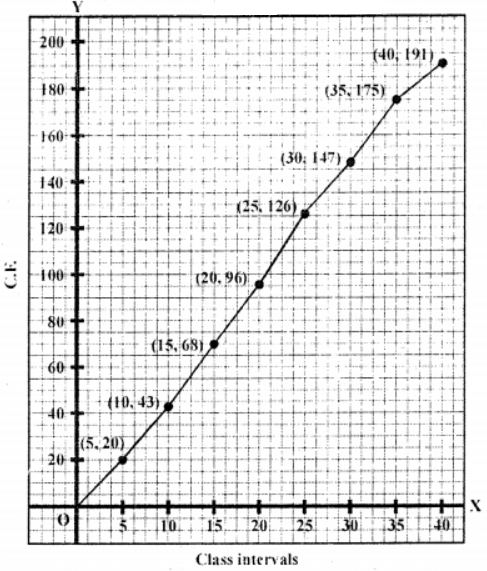
(b)
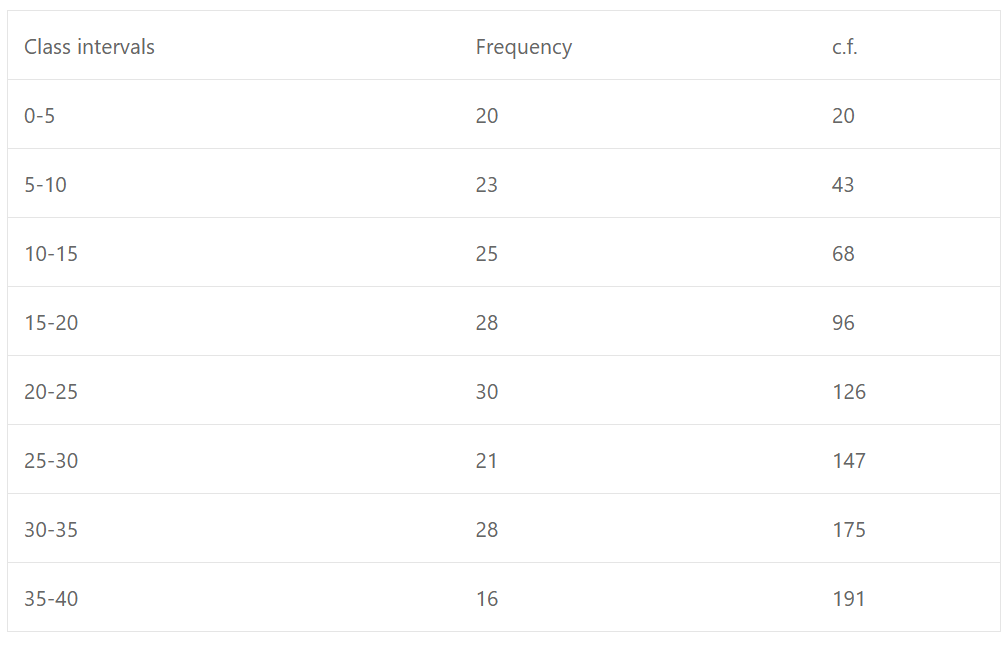
Now we shall plot the points (5,20), (10,43), (15,68), (20,96), (25,126), (30,147), (35,175) and (40,191) on the graph and join them with free hand to get an ogive as shown :
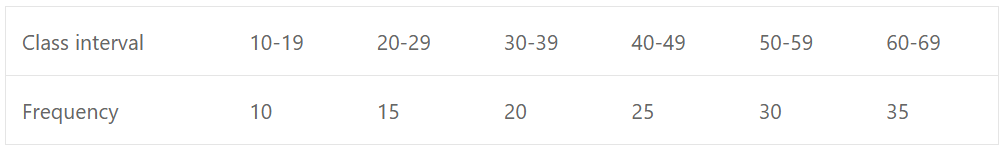
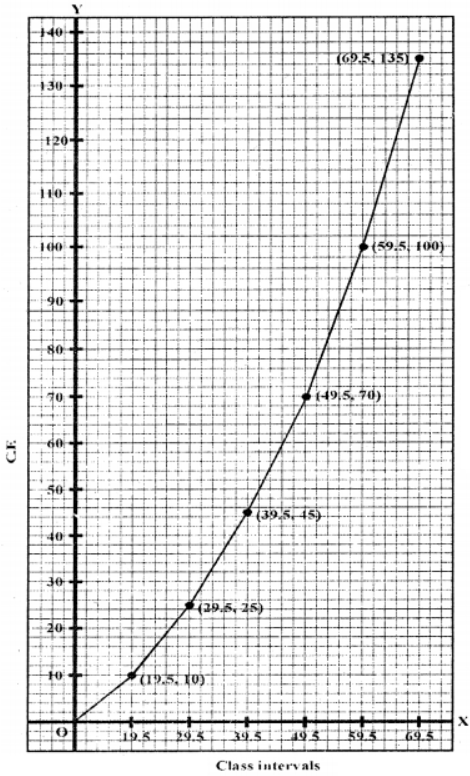
(c)
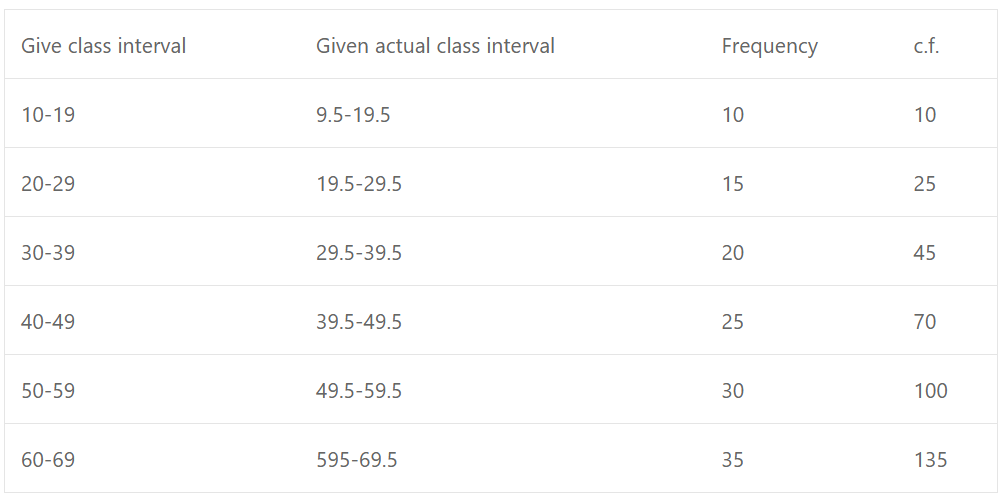
Now we shall plot the points (19.5, 10), (29.5, 25), (39.5, 45), (49.5, 70), (59.5, 100) and (69.5, 135) on the graph and join them with free hand to get an ogive.
Que-3: Each of the 25 students in a class was given a home assignment comprising 10 questions in mathematics. The data given below show the number of questions solved and submitted by individual students on the next day. 1, 4, 5, 6, 0, 9, 3, 2, 3, 4, 6, 4, 5, 2, 7, 5, 2, 2, 3, 5, 1, 0, 7, 6, 3
(a) Taking classes as 0-2, 2-4, 4-6, etc., make a frequency table for the above distribution.
(b) Draw an Ogive (cumulative frequency curve) to represent the given data.
Sol:
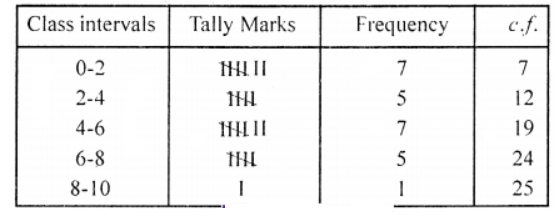
To draw its ogive, we plot the points (2, 7), (4, 12), (6, 19), (8, 24), (10, 25) on the graph and join them with free hand the ogive as shown
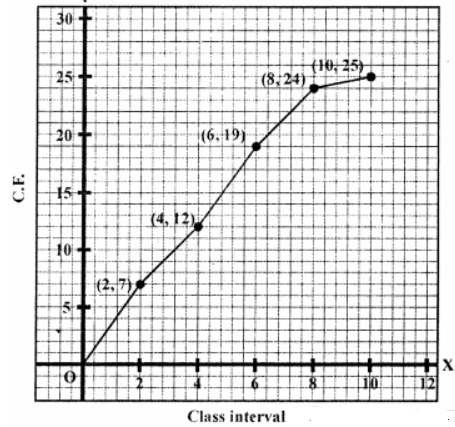
Que-4: Draw an ogive from the following table :
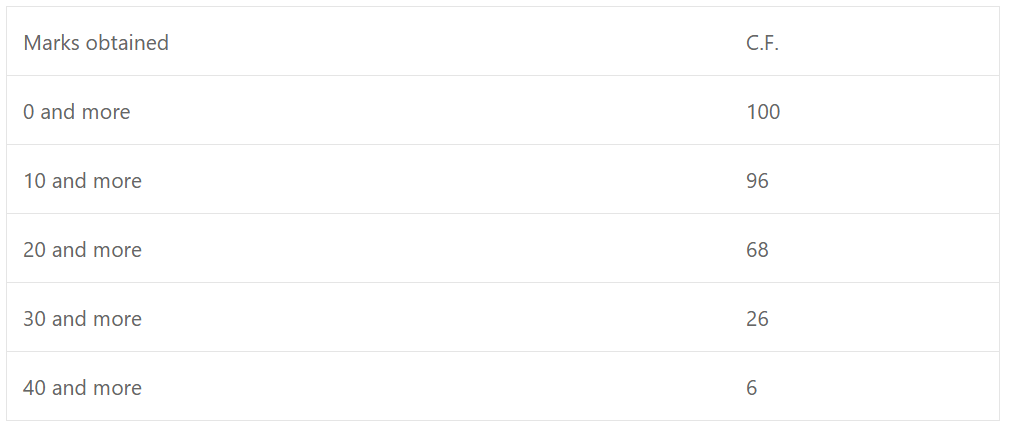
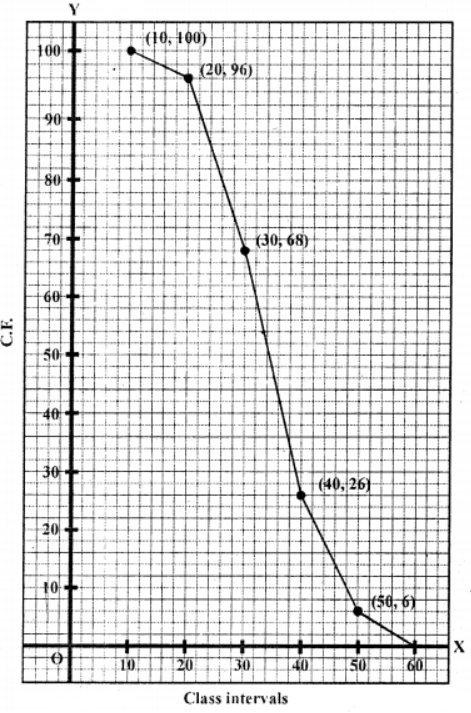
Sol:
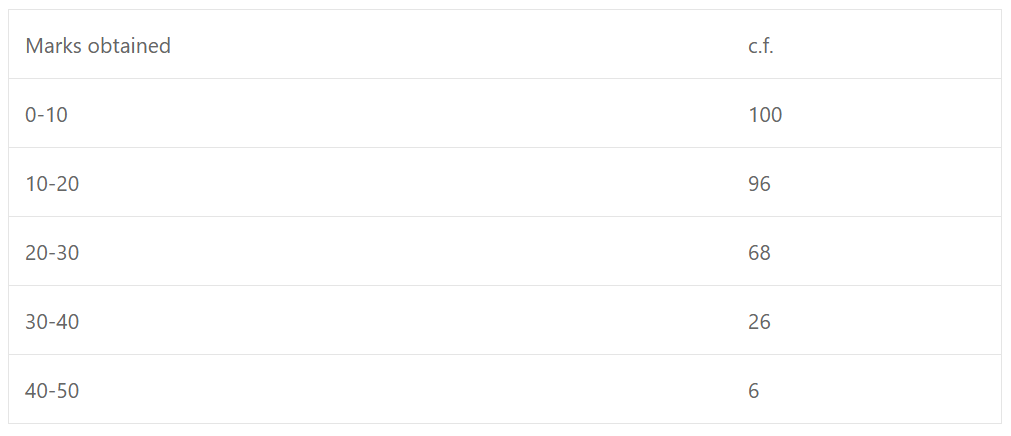
Now we plot the points (10, 100), (20, 96), (30, 68), (40, 26) and (50, 6) on the graph and join them with free hand to get ogive as shown.
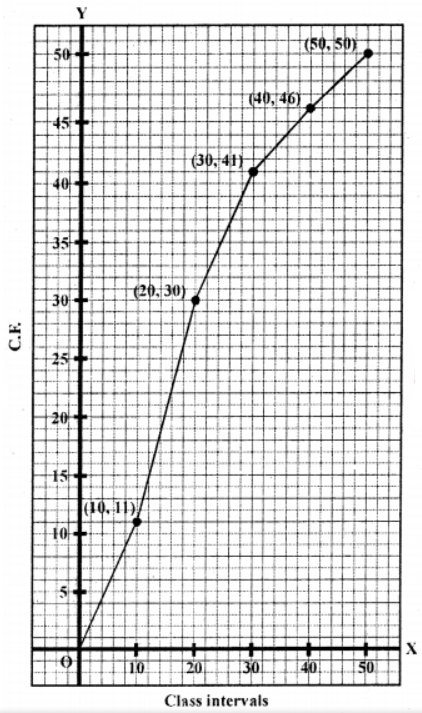
Que-5: The marks secured by 50 students were as under:
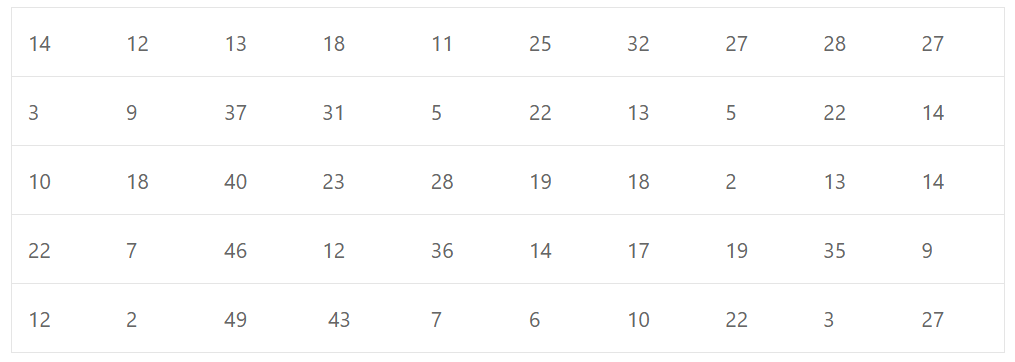
Taking the size of each class-interval as 10, prepare frequency table and with its help draw a cumulative frequency curve.
Sol: Highest marks = 49
Lowest marks = 2
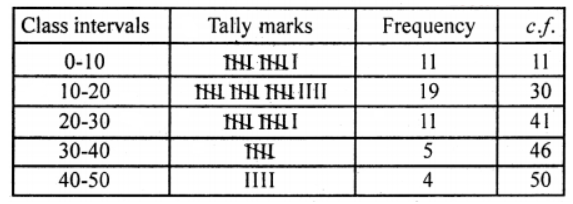
Now we shall plot the points (10, 11), (20, 30), (30, 41), (40, 46) and (50, 50) on the graph and join them with free hand to get an ogive as shown.
Que-6: What is an Ogive curve? How is it useful? A group of 140 workers in a factory were given a work aptitude test. The distribution of their scores is given below :
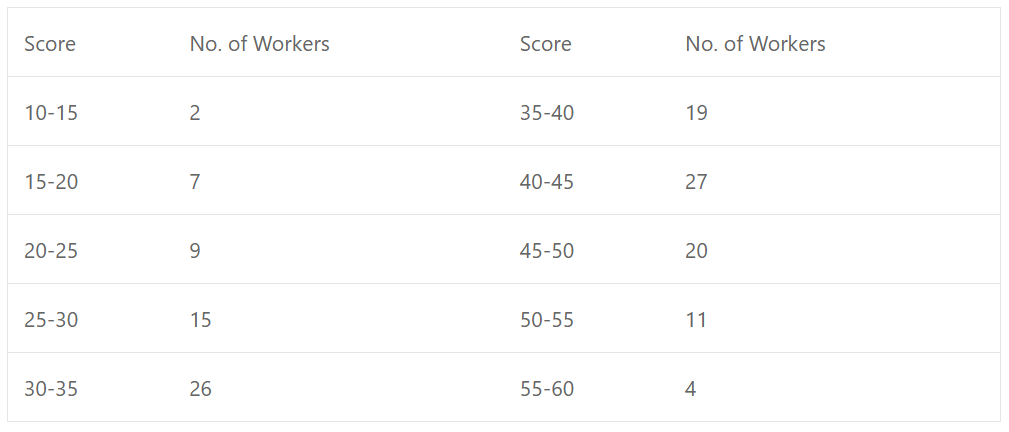
Draw an Ogive curve.
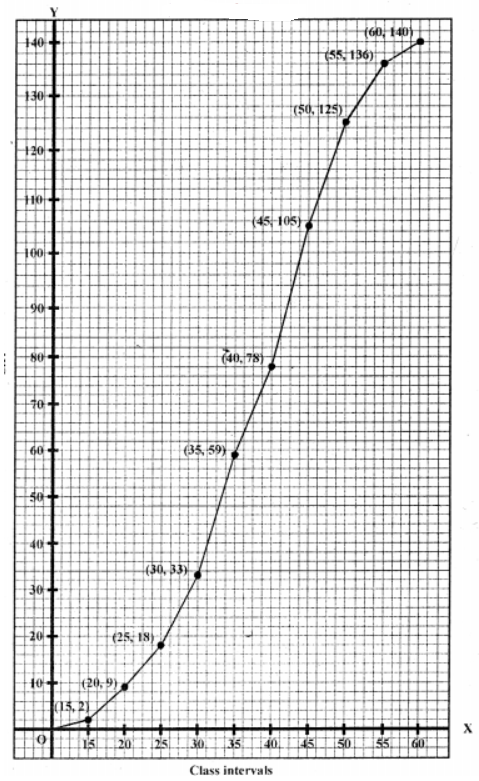
Sol: Ogive is a graph of cumulative frequency distribution which is drawn in a free hand curve.
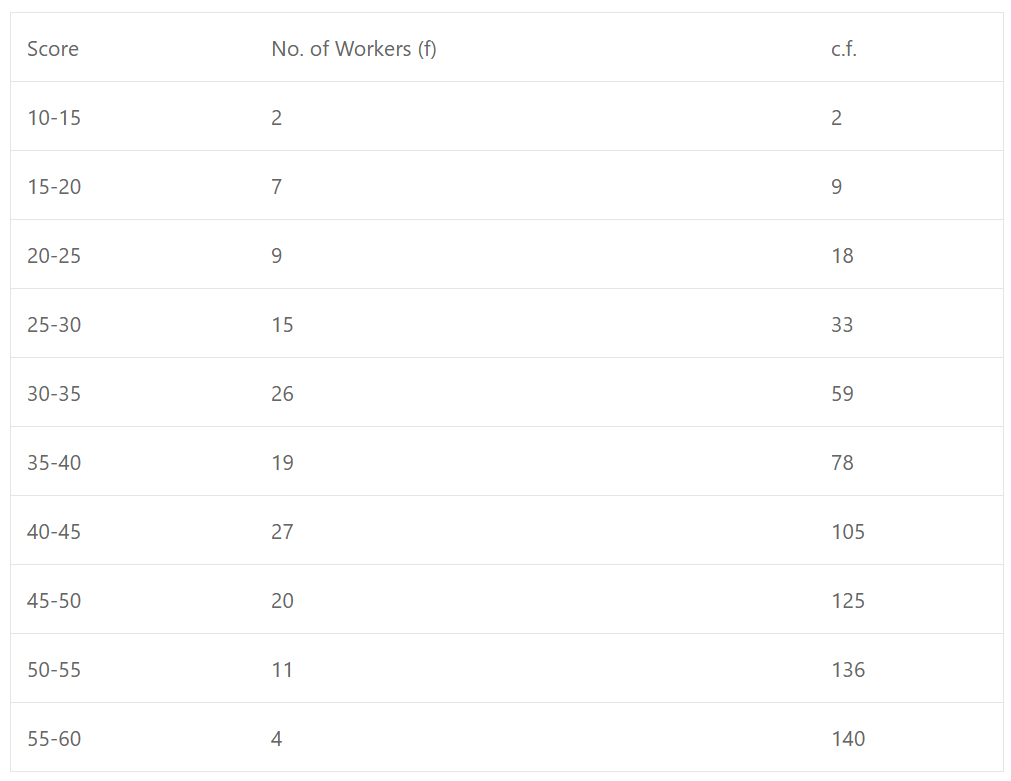
Now we shall plot the points (15, 2), (20, 9), (25, 18), (30, 33), (35, 59), (40, 78), (45, 105), (50, 125), (55, 136) and (60, 140) on the graph and join them with free hand to get an ogive as shown.
–: End of Histogram and Ogive Class 10 OP Malhotra Exe-19C ICSE Maths Step by Step Solutions :–
Return to : OP Malhotra S Chand Solutions for ICSE Class-10 Maths
Thanks
Please Share with Your Friends


