ML Aggarwal Measures of Central Tendency Exe-21.4 Class 10 ICSE Maths Solutions. We Provide Step by Step Answer of Exe-21.4 Questions for Measures of Central Tendency as council prescribe guideline for upcoming board exam. Visit official Website CISCE for detail information about ICSE Board Class-10.
ML Aggarwal Measures of Central Tendency Exe-21.4 Class 10 ICSE Maths Solutions
| Board | ICSE |
| Subject | Maths |
| Class | 10th |
| Chapter-21 | Measures of Central Tendency |
| Writer / Book | Understanding |
| Topics | Solutions of Exe-21.4 |
| Academic Session | 2024-2025 |
Measures of Central Tendency Exe-21.4
ML Aggarwal Class 10 ICSE Maths Solutions
Question 1. Draw a histogram for the following frequency distribution and find the mode from the graph :

Answer :

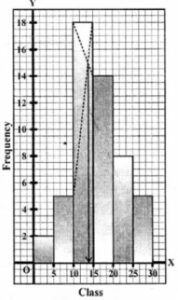
Mode = 14
Question 2. A Mathematics aptitude test of 50 students was recorded as follows :

Draw a histogram for the above data using a graph paper and locate the mode. (2011)
Answer :
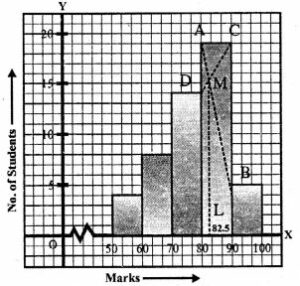
Hence, the required mode is 82.5.
Question 3. Draw a histogram and estimate the mode for the following frequency distribution :

Answer :

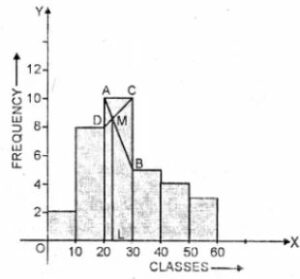
Representing classes on x-axis and frequency on the y-axis,
we draw a histogram as shown.
In the histogram, join AB and CD intersecting at M.
From M, draw ML perpendicular to the x-axis. L shows the mode
Hence Mode = 23
Measures of Central Tendency Exe-21.4
ML Aggarwal Class 10 ICSE Maths Solutions
Page 506
Question 4. Using a graph paper draw a histogram for the given distribution showing the number of runs scored by 50 batsmen. Estimate the mode of the data

Answer :
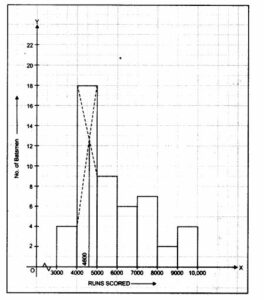
Question 5. Use a graph paper for this question. The daily pocket expenses of 200 students in a school are given below:
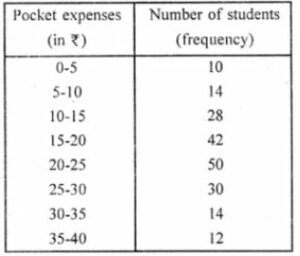
Draw a histogram representing the above distribution and estimate the mode from the graph.
Answer :
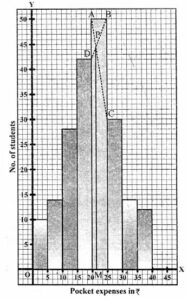
Mark the upper comers of the highest rectangle
and the corners of the adjacent rectangles as A, B, C, D as shown.
Join AC and BD to intersect at P. Draw PM ⊥ x-axis.
Then the abscissa of M is 21, which is the required mode.
Hence, mode = 21
Question 6. Draw a histogram for the following distribution :

Hence estimate the modal weight.
Answer :
We write the given distribution in the continuous form :

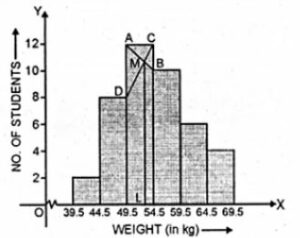
Representing the weight (in kg) on x-axis
and No. of students on y-axis. We draw a histogram as shown.
Now join AB and CD intersecting each other at M.
From M, draw ML perpendicular to x-axis.
L is the mode which is 51.5 kg
Question 7. Find the mode of the following distribution by drawing a histogram

Also state the modal class.
Answer :
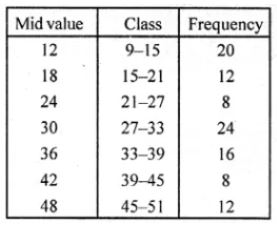
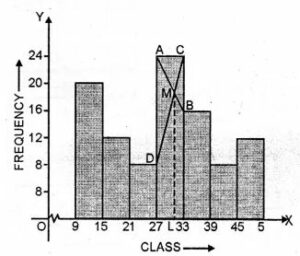
Representing class on x-axis and frequency on the y-axis,
we draw a histogram as shown.
Join AB and CD intersecting each other at M.
From M, draw ML perpendicular to the x-axis.
L shows the mode which is 30.5 and class is 27-33.
–: End of ML Aggarwal Measures of Central Tendency Exe-21.4 Class 10 ICSE Maths Solutions :–
Return to :- ML Aggarwal Solutions for ICSE Class-10
Thanks
Please Share with Your Friends
