Statistics Class-8 RS Aggarwal ICSE Goyal Brothers Prakashan Solutions Chapter-25. We provide step by step Solutions of Exercise / lesson-25 Statistics for ICSE Class-8 RS Aggarwal Mathematics.
Our Solutions contain all type Questions of Exe-25 with Notes to develop skill and confidence. Visit official Website CISCE for detail information about ICSE Board Class-8 Mathematics.
–: Select Topics :–
Notes on Statistics
Introduction to Statistics
– A study dealing with the collection, presentation and interpretation and analysis of data is called as statistics
Data
- Facts /figures numerical or otherwise collected for a definite purpose is called as data.
- data collected first-hand data:- Primary
- Secondary data: Data collected from a source that already had data stored
Frequency
– The number of times a particular instance occurs is called frequency in statistics.
Ungrouped data
Ungrouped data is data in its original or raw form. The observations are not classified in groups.
Grouped data
In grouped data, observations are organized in groups
Class Interval
- The size of the class into which a particular data is divided.
- E.g divisions on a histogram or bar graph.
- Class width = upper class limit – lower class limit
Regular and Irregular class interval
- Regular class interval: When the class intervals are equal or of the same sizes.
- E.g 0-10, 10-20, 20-30…..
- Irregular class interval: When the class intervals are of varying sizes.
- E.g 0-35, 35-45, 45-55,
Frequency table
– A frequency table or distribution shows the occurrence of a particular variable in a tabular form.
Sorting
- Raw data needs to be sorted in order to carry out operations.-
- Sorting ⇒ ascending order or descending order
Ungrouped frequency table
– When the frequency of each class interval is not arranged or organised in any manner
Grouped frequency table
– The frequencies of the corresponding class intervals are organised or arranged in a particular manner, either ascending or descending.
Exe-25 ,Statistics Class-8 RS Aggarwal ICSE Goyal Brothers Prakashan Solutions
Question 1:
Arrange the following data in ascending order:
(i) 8, 3, 11, 15, 1, 7, 16, 25, 9, 4
(ii) 5.7, 9.2, 3.1, 4.6, 1.8, 10.4, 2.5, 0.9, 1.2.
Answer :
(i) Ascending order is
1, 3, 4, 7, 8, 9, 11, 15, 16, 25
(ii) Ascending order is
0.9, 1.2, 1.8, 2.5, 3.1, 4.6, 5.7, 9.2, 10.4.
Question 2:
Arrange the following data in descending order:
(i) 15, 3, 0, 11,7, 2, 23, 14, 29, 5, 1, 17.
(ii) 23, 4.6, 1.2, 0.4, 3.5, 9.7, 6.1, 4.8, 0.8, 1.0.
Answer :
(i) Descending order is
29, 23, 17, 15, 14, 11. 7, 5, 3, 2, 1, 0.
(ii) Descending order is
9.7, 6.1, 4.8, 4.6, 3.5, 2.3, 1.2, 1.0, 0.8, 0.4.
Question 3:
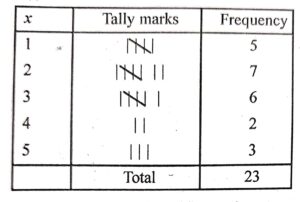
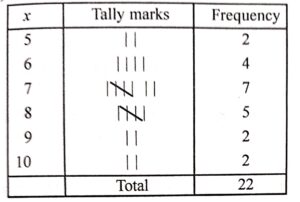
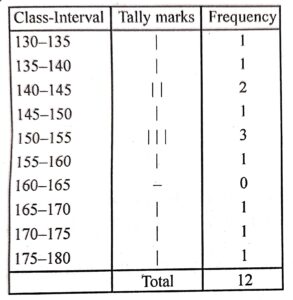
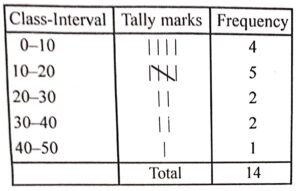
Construct a frequency table for each of the following data:
(i) 3, 2, 5, 4, 1, 3, 2, 2, 5, 3, 1, 2, 1, 1, 2, 2, 3, 4, 5, 3, 1, 2, 3.
(ii) 7, 8, 6, 5, 6, 7, 7, 9, 8, 10, 7, 6, 7, 8, 8, 9, 10, 5, 7, 8, 7, 6.
(iii) 152, 165, 172, 144, 135, 156, 175, 140, 132, 150, 153, 147.
(iv) 13, 25, 19, 16, 8, 30, 27, 6, 0, 34, 40, 11, 4, 17.
Answer :
(i)
(ii)
(iii)
(iv)
Question 4:
Fill in the blanks:
(i) Lower limit of the class interval 14-22 is……………
(ii) Upper limit of the class interval 16-25 is…………..
(iii) Class-size of the class interval 20-30 is…………..
(iv) the upper and lower limits of a class interval be 18 and 11 respectively, then the class-interval is ………….
(v) If the lower and upper limits of a class interval be 11:5 and 21-5 respectively, then the class-
interval is………………
Answer :
(i) 14
(ii) 25
(iii) 10
(iv) 11-18
(v) 11.5-21.5
Question 5:
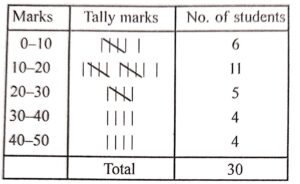
The marks out of 50. obtained by 30 students of a class in an examination are given below:
40, 12, 46, 37, 17, 27, 30, 6, 2, 23, 19, 39, 25, 5, 33, 19, 21, 12, 41, 17, 12, 19, 17, 8, 10, 1, 9, 21, 13, 48
Arrange them in ascending order and present it as a grouped data. by taking class-intervals
0-10, 10-20, 20-30, 30-40, 40-50.
Answer :
In Ascending order :
1, 2, 5, 6, 8, 9, 10, 12, 12, 12, 13, 17, 17, 17, 19, 19, 19, 21, 21, 23, 25, 27, 30, 33., 17. 39, 40, 41, 46, 48.
Question 6:
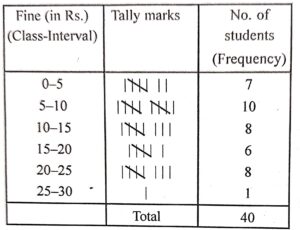
The fine imposed (in rupees) on 40 pupils for being absent is given below :
18, 8, 12, 6, 8, 16, 12, 5, 23, 2, 16, 23, 2, 10, 20, 12, 9, 7, 0, 5, 3, 6, 27, 21, 19, 15, 20, 24, 2, 16, 14, 8, 23, 24, 10, 14, 3, 8, 11, 2.
Present the data in the form of frequency distribution table by taking class intervals 0-5, 5-10, 10-15, 15-20, 20-25.
Answer :
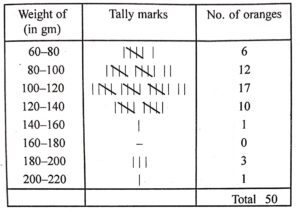
P. Q. The weights in grams of 50 oranges are as follows:
126, 86, 70, 92, 11, 136, 141, 111, 107, 80, 110, 104, 118, 131, 113, 82, 75, 204. 81, 108, 100, 123, 90, 78, 90, 115, 110, 98, 106, 99, 107, 84, 76, 186, 82, 125, 123, 195, 68, 130, 128, 129, 139, 187, 93, 119, 115, 107, 115, 75.
From the grouped frequency table by taking class-intervals.
60-80, 80-100, 100-120, 12-140, 140-160, 160-180, 180-200, 200-220.
Answer :
Question 7:
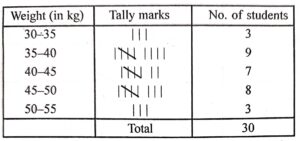
The weights (in kg) of 30 students are given below:
48, 55, 30, 43, 41, 36, 48, 37, 34, 38, 46, 42, 38, 52, 37, 34, 40, 42, 50, 37, 35, 46, 42, 43, 37, 39, 45, 48, 46.
Form the grouped frequency table by taking class-intervals 30-35, 35-40, 40-45, 45-50, 50-55.
Answer :
Question 8:
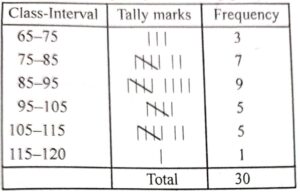
The daily income (in rupees) of 30 workers is given below:
83, 96, 91, 80, 97, 111, 90, 83, 112, 120, 103, 77, 82, 90, 70, 68, 89, 85, 78, 105, 94, 97, 90, 89, 102, 113, 90, 106, 70, 84.
Construct a frequency table using groups 65-75, 75-85, 85-95, 95-105, 105-115, 115-125.
Answer :
Question 9:
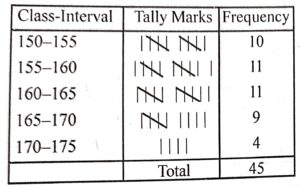
The heights of 45 students measured to the nearest centimeter are given below:
155, 166, 159, 161, 158, 154, 153, 159, 157, 152, 160, 157. 158, 170, 152, 151, 162, 164, 171, 154, 165, 161, 150, 168, 162, 154, 160, 170, 163, 164, 165, 169, 165, 155, 157, 158, 160, 161, 156, 153. 150, 165, 167, 169, 172.
Prepare a frequency table taking the class intervals
150-155, 155-160, 160-165, 165-170, 170-175.
Answer :
Question 10:
Complete the table given below:
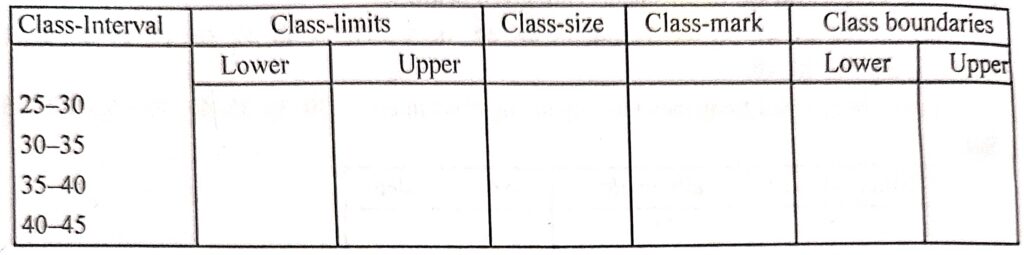
Answer :
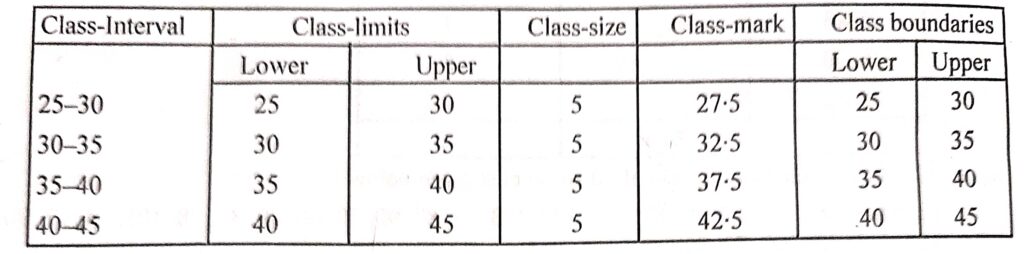
Class-mark of 25-30 = (25 + 30)/2
= 55/2
= 27.5
Question 11:
Complete the table given below:
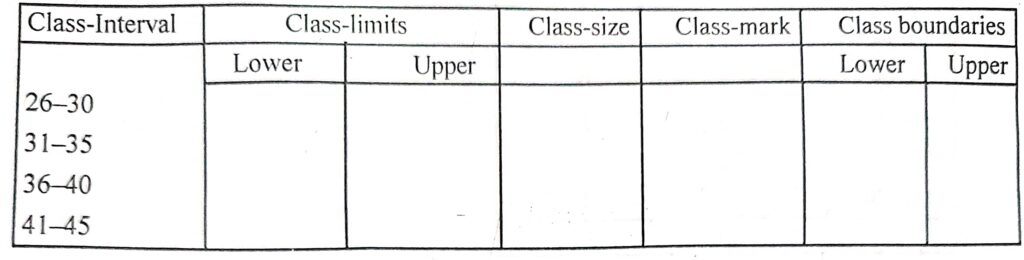
Answer :
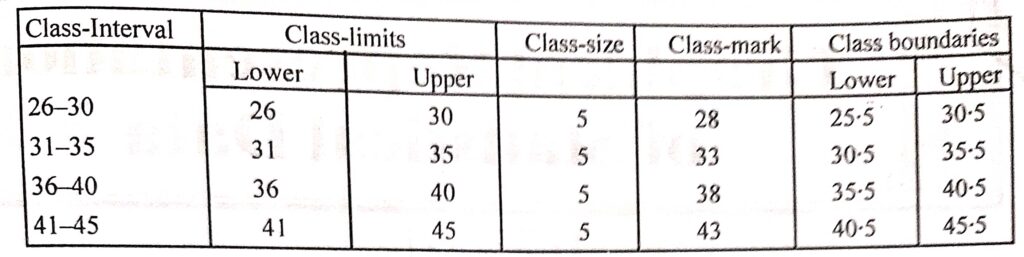
Class-mark of 26-30 = (26 + 30)/2
= 56/2
= 28
–: End of Statistics Class-8 RS Aggarwal Solutions :–
Return to- RS Aggarwal Solutions for ICSE Class-8 Goyal Brothers Prakashan
Thanks


2 thoughts on “Statistics Class-8 RS Aggarwal ICSE Goyal Brothers Prakashan”
Super and excellent and thanks
thanks