Graphical Representation Histograms and Ogives Class 10 Concise Exe-23A ICSE Maths Selina Solutions Ch-23. In this article you would learn how to solve problems / questions on Graphical Representation (Histograms, Frequency Polygon and Ogives). Visit official website CISCE for detail information about ICSE Board Class-10 Mathematics.

Graphical Representation Histograms and Ogives Class 10 Concise Exe-23A ICSE Maths Selina Solutions Ch-23
| Board | ICSE |
| Publications | Selina |
| Subject | Maths |
| Class | 10th |
| Chapter-23 | Graphical Representation (Histograms, Frequency Polygon and Ogives) |
| Writer | R.K. Bansal |
| Exe-23A | Histogram For Continuous and Discontinuous Grouped of Data and Ogive. |
| Edition | 2025-2026 |
Histogram For Continuous and Discontinuous Grouped of Data and Ogive
Class 10 Concise Exe-23A ICSE Maths Selina Solutions Ch-23 Graphical Representation (Histograms, Frequency Polygon and Ogives)
Que-1: Draw histograms for the following frequency distributions :
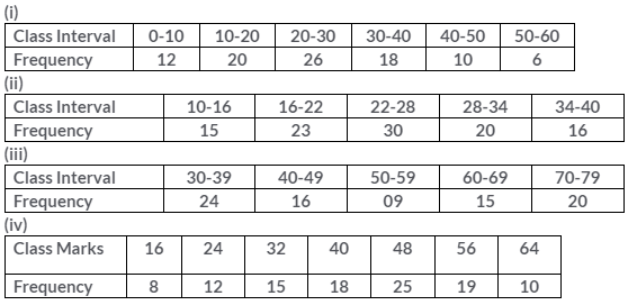
Sol: (i)
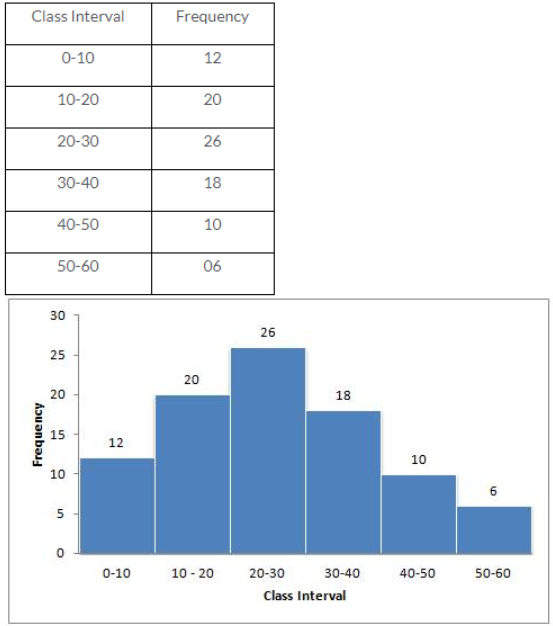
Steps of Constructions :
(a) Taking suitable scales, mark class intervals on x-axis and frequency on y-axis.
(b) Construct rectangles with class intervals as bases and corresponding frequencies as heights.
(ii)
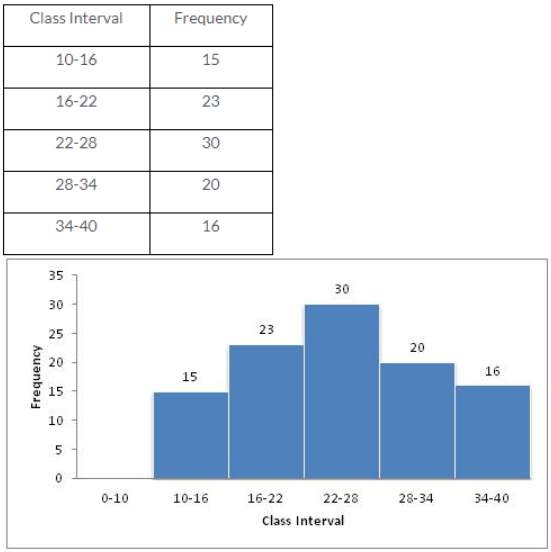
Steps of Constructions :
(a) Taking suitable scales, mark class intervals on x-axis and frequency on y-axis.
(b) Construct rectangles with class intervals as bases and corresponding frequencies as heights.
(iii)
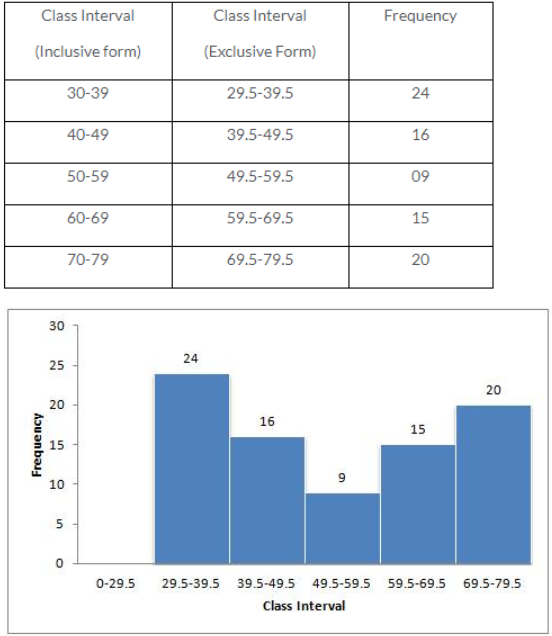
Steps of Constructions :
(a) Taking suitable scales, mark class intervals on x-axis and frequency on y-axis.
(b) Construct rectangles with class intervals as bases and corresponding frequencies as heights.
(iv)
Steps of Constructions :
(a) Taking suitable scales, mark class intervals on x-axis and frequency on y-axis.
(b) Construct rectangles with class intervals as bases and corresponding frequencies as heights.
Que-2: Draw a cumulative frequency curve (ogive) for each of the following distributions :
Sol: (i)
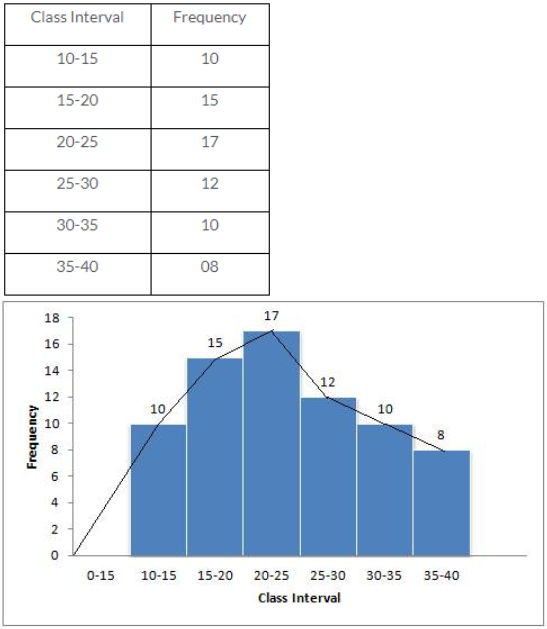
Steps of constructions :
(a) Taking suitable scales, mark class intervals on x-axis and frequency on y-axis
(b) Construct rectangles with class intervals as bases and corresponding frequencies as heights.
(c) Join the mid-points of the rectangle to obtain the ogive.
(ii)
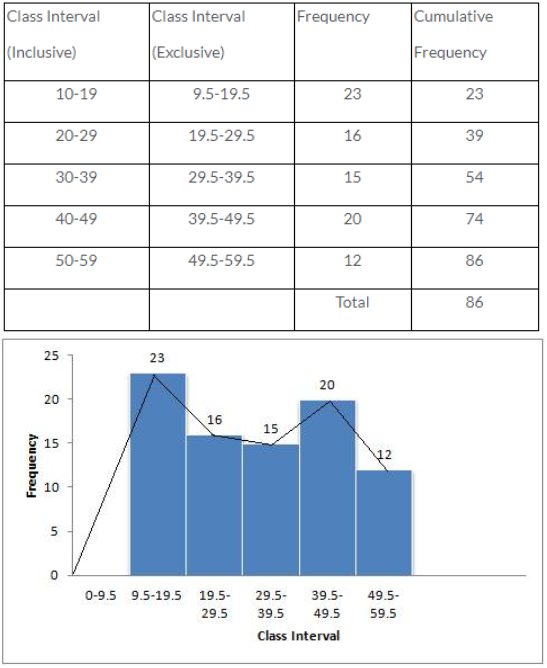
Steps of constructions :
(a) Convert the data into exclusive form.
(b) Taking suitable scales, mark class intervals on x-axis and frequency on y-axis
(c) Construct rectangles with class intervals as bases and corresponding frequencies as heights.
(d) Join the mid-points of the rectangle to obtain the ogive.
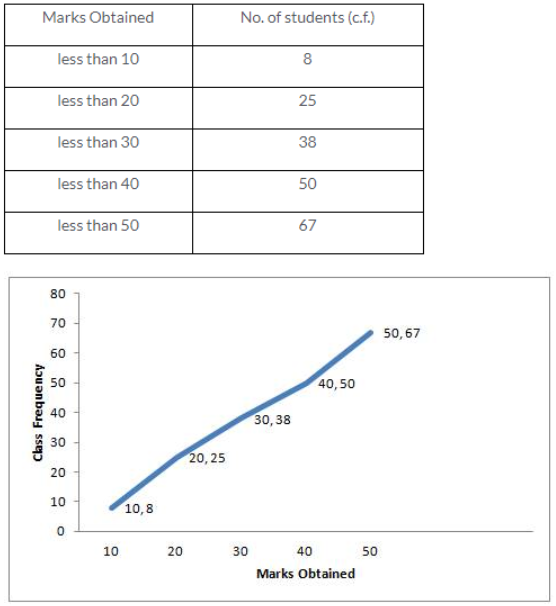
Que-3: Draw an ogive for each of the following distributions :
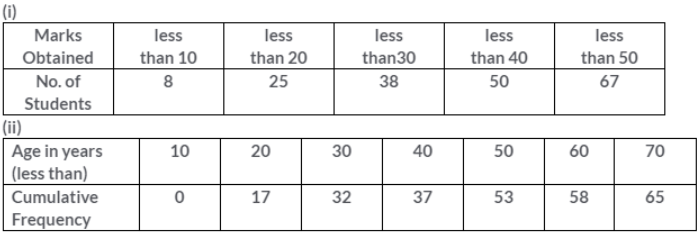
Sol: (i)
Steps of constructions :
(a) Plot the points (10,8), (20,25), (30,38), (40,50) and (50,67) on the graph
(b) Join with them free hand to obtain an ogive.
(ii)
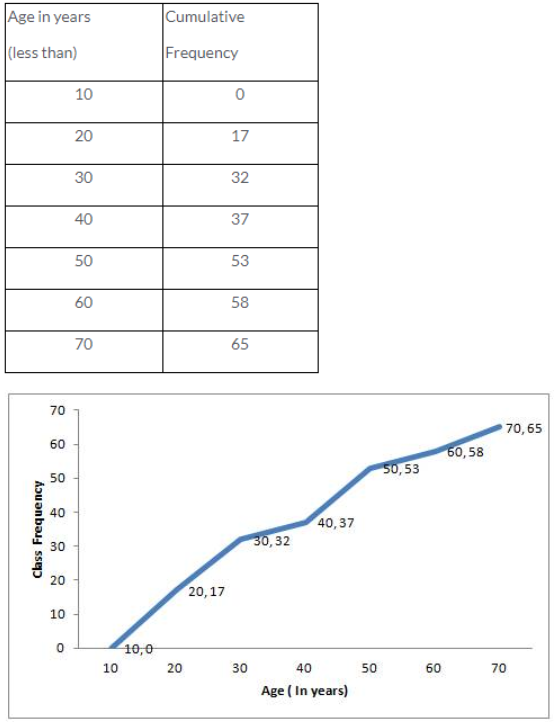
Steps of constructions :
(a) Plot the points (10,0), (20,17), (30,32), (40,37), (50,53), (60,58) and (70,65) on the graph
(b) Join with them free hand to obtain an ogive.
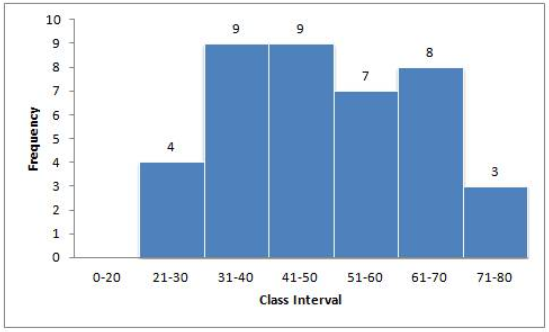
Que-4: Construct a frequency distribution table for the number given below, using the class intervals 21-30, 31-40 … etc.
75, 67, 57, 50, 26, 33, 44, 58, 67, 75, 78, 43, 41, 31, 21, 32, 40, 62, 54, 69, 48, 47, 51, 38, 39, 43, 61, 63, 68, 53, 56, 49, 59, 37, 40, 68, 23, 28, 36, 47 Use the table obtained to draw: (i) a histogram (ii) an ogive
Sol:
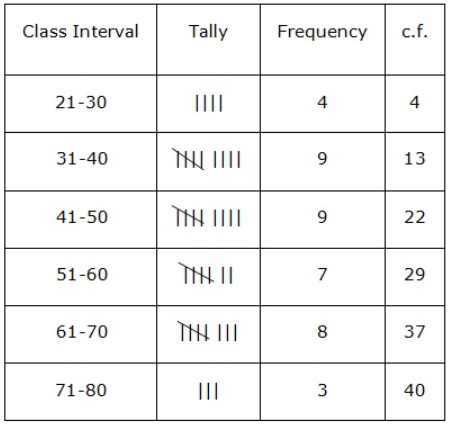 (i)
(i)
(ii)
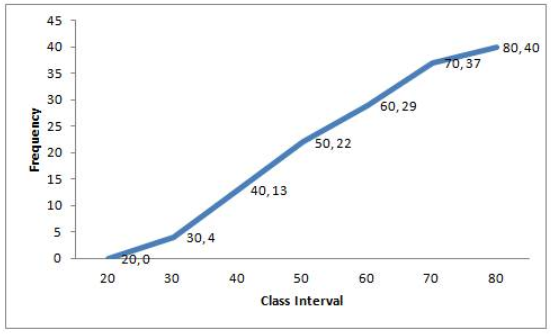
Plot the points (30,4), (40,13), (50,22), (60,29), (70,37) and (80,40) on the group and join them with free hand to obtain ogive.
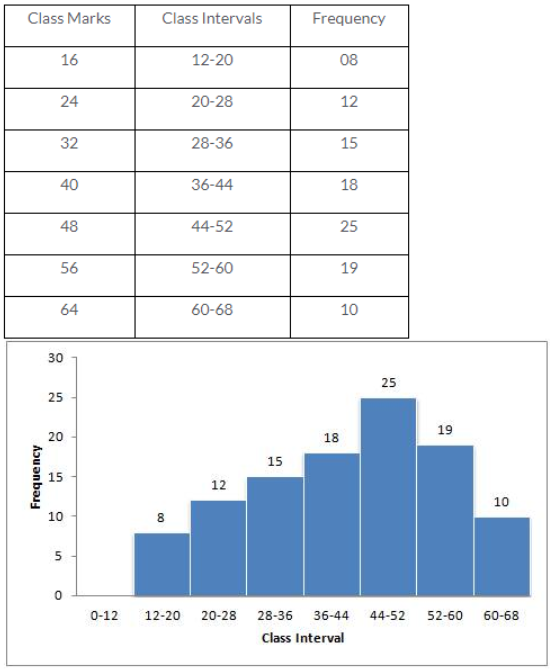
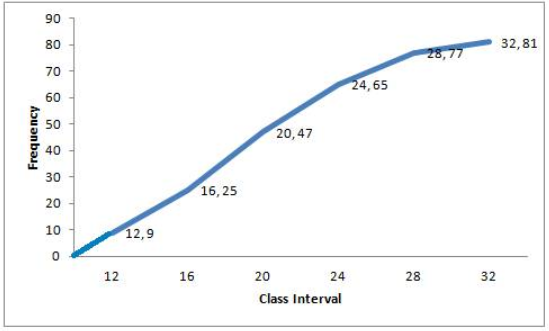
Que-5: (a) Use the information given in the adjoining histogram to construct a frequency table.
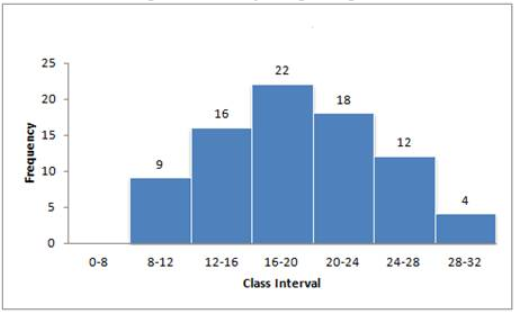
(b) Use this table to construct an ogive.
Sol: (a)
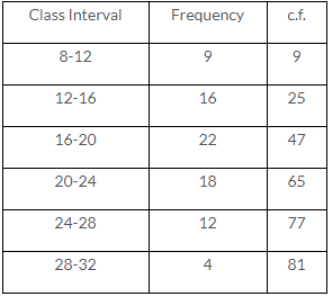
(b) Now plot the points (12,9), (16,25), (20,47), (24,65), (28,77), (32,81) and join them to give an ogive.
Que-6: (a) From the distribution, given below, construct a frequency table (b) Use the table obtain in part (a) to draw : (i) a histogram (ii) an ogive
![]()
Sol: (a) Difference in consecutive class marks = 17.5 – 12.5 = 5
first class interval will be 10-15 and so on.
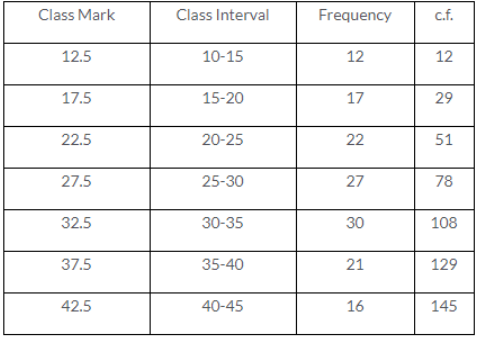
Total = 145
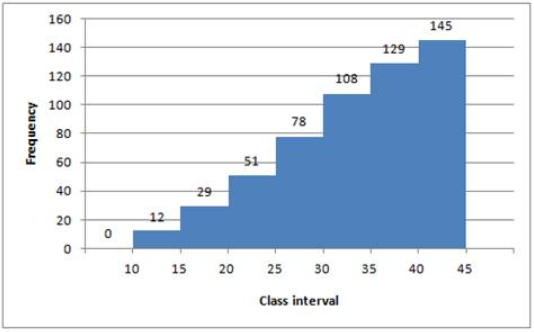
(b) Now plot the points (15,12), (20,29), (25,51), (30,78), (35,108), (40,129), (45,145) and join them to obtain an ogive.
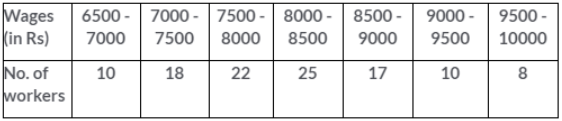
Que-7: Use graph paper for the question. The table given below shows the monthly wages of some factory workers
(i) Using the table, calculate the cumulative frequencies of the workers
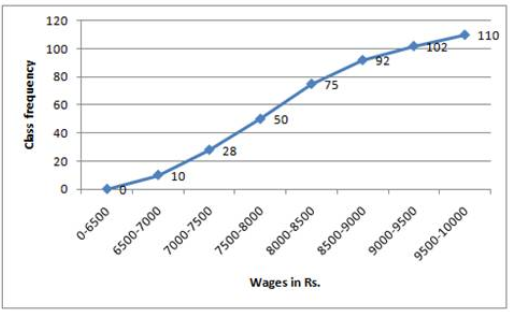
(ii) Draw a cumulative frequency curve.
Use 2cm = Rs500, starting the origin at Rs6500 on x-axis and 2em = IO workers on the y-axis.
Sol: (i)
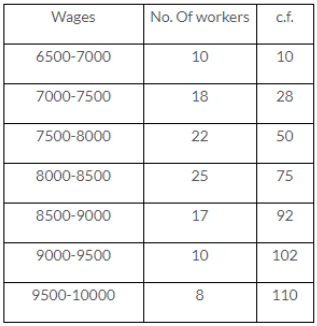
Total = 110
Now plot the points (700,10), (7500,28), (8000,50), (9000,92) and (10000,110) and join them to obtain an ogive.
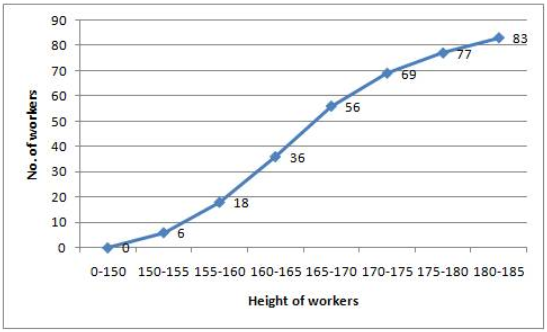
Que-8: The following tables show the distribution of the heights of a group of factory workers :
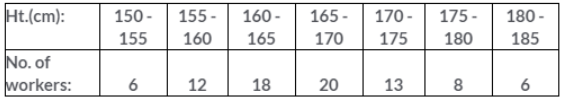
(i) Determine the cumulative frequencies
(ii) Draw the ‘less than’ cumulative frequency curve on graph paper. Use 2cm = 5cm height on the one axis and 2cm = 10 workers on the others.
Sol: (i)
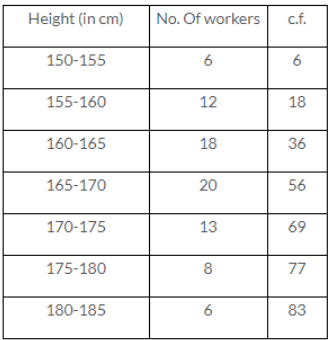
We plot the points (155,6), (160,18), (165,36), (170,56), (175,69), (180,77) and (185,83) on the graph and join them in free hand to obtain an ogive.
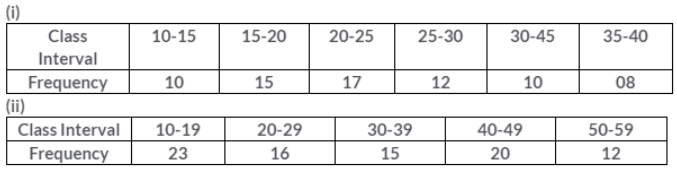
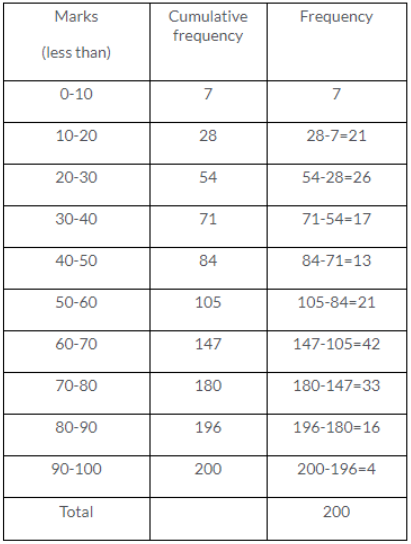
Que-9: Construct a frequency distribution table for each of the following distributions :
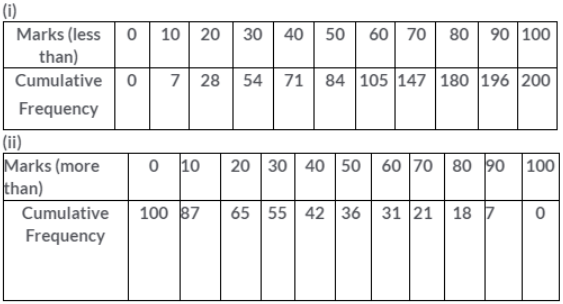
Sol: (i)
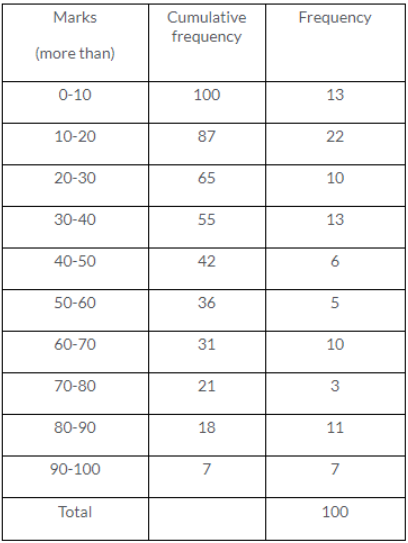
(ii)
— : Graphical Representation Histograms and Ogives Class 10 Concise Exe-23A ICSE Maths Selina Solutions :–
Return to :- Selina Concise Solutions for ICSE Class-10 Maths
Please Share with Your Friends
Thanks


2 thoughts on “Graphical Representation Histograms and Ogives Class 10 Concise Exe-23A ICSE Maths Selina Solutions”
I think Roman number 2 (1,2 is wrong)
update soon if such error