Histogram and Ogive Class 10 OP Malhotra Exe-19A ICSE Maths Solutions Ch-19. Step by step solutions of questions as latest prescribe guideline for upcoming exam. In this article you would learn to Construct Histogram Visit official Website CISCE for detail information about ICSE Board Class-10 Mathematics.
Histogram and Ogive Class 10 OP Malhotra Exe-19A ICSE Maths Solutions Ch-19
| Board | ICSE |
| Publications | S Chand |
| Subject | Maths |
| Class | 10th |
| Chapter-19 | Histogram and Ogive |
| Writer | OP Malhotra |
| Exe-19A | Construct Histogram |
| Edition | 2024-2025 |
How to Construct Histogram of Exclusive Form
Begin by marking the class intervals on the X-axis and frequencies on the Y-axis.
The scales for both the axes have to be the same.
- Class intervals need to be exclusive.
- Draw rectangles with bases as class intervals and corresponding frequencies as heights.
- A rectangle is built on each class interval since the class limits are marked on the horizontal axis, and the frequencies are indicated on the vertical axis.
- The height of each rectangle is proportional to the corresponding class frequency if the intervals are equal.
- The area of every individual rectangle is proportional to the corresponding class frequency if the intervals are unequal.
Exercise- 19A
Histogram and Ogive Class 10 OP Malhotra ICSE Maths Solutions Ch-19
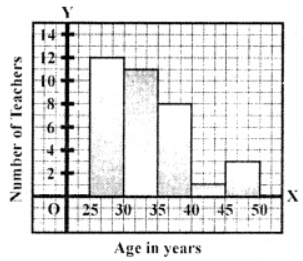
Que-1: Represent the following distribution of ages (in years) of 35 teachers in a school by means of a histogram.
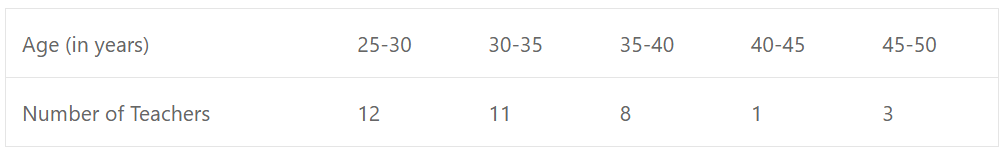
Sol: Draw the axis and represent the age (in years) along x-axis and number of teachers (frequencies) along y-axis and prepare the histogram as given under.
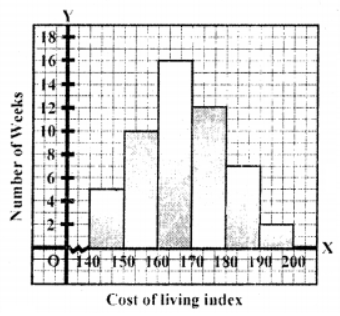
Que-2: The weekly observations on cost of living index in a certain city for a year give the following frequency table :
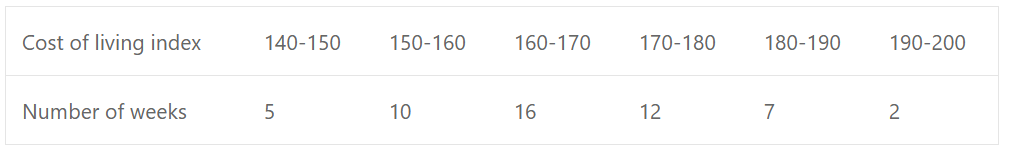
Draw histogram to represent the data.
Sol: We represent the cost of living index along x-axis and number of weeks (frequencies) along they- axis and prepare the histogram as given below.
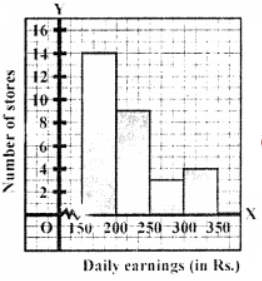
Que-3: Draw a histogram for daily earning of 20 drug stores given in the following data :
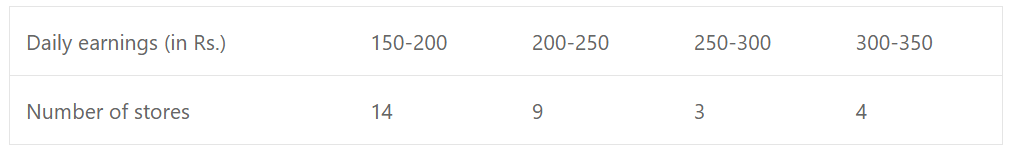
Sol: We represent daily earnings in rupees along x-axis and number of stores along y-axis and prepare the histogram as shown in the figure given here.
Que-4:
(a) 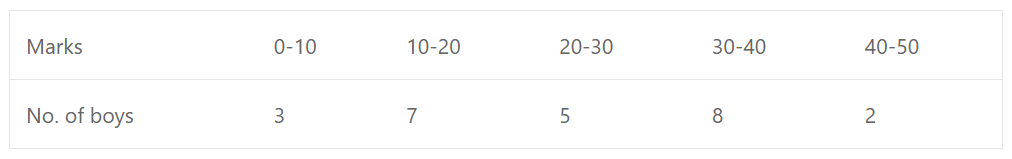
(b)
(c)
(d)
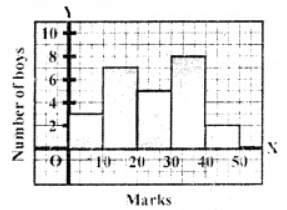
Sol: (a) We represent marks on the x-axis and number of boys v-axis and prepare the histogram as given here.
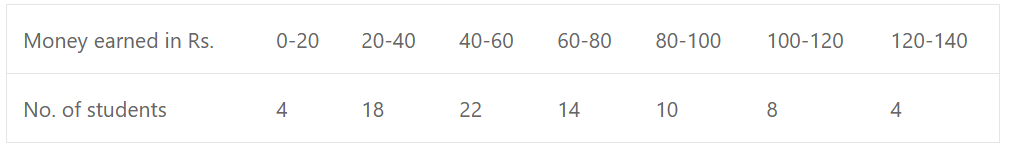
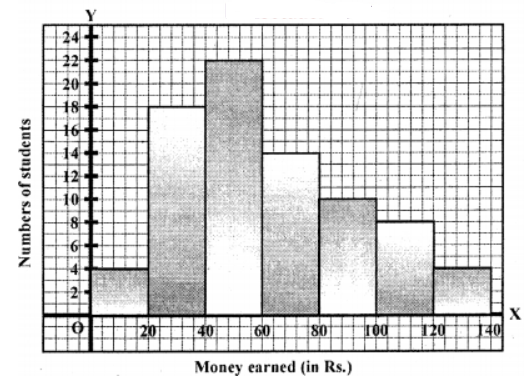
(b) We represent money earned along x-axis and no. of students on they-axis and prepare the histogram as shown here.
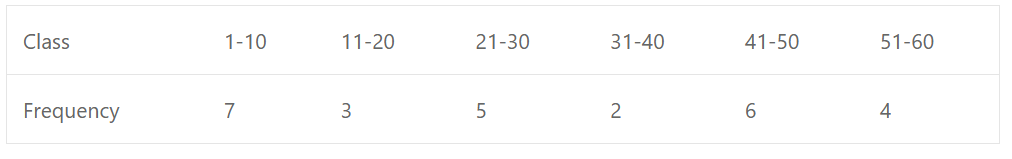
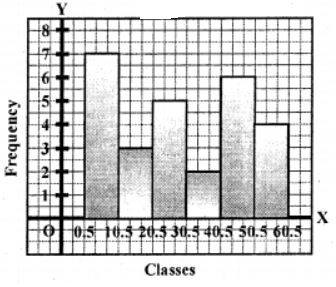
(c) We represent class along x-axis and frequencies along y-axis and prepare the histogram as shown here.
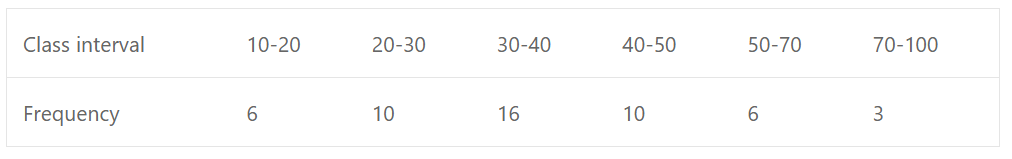
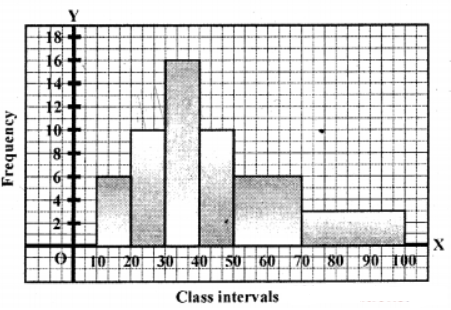
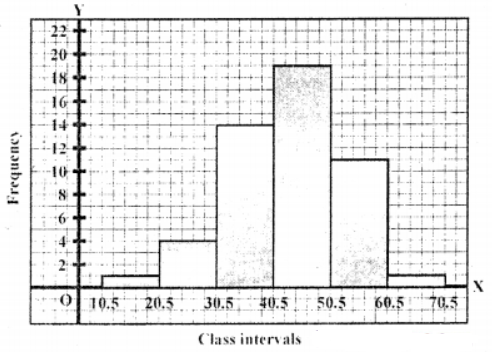
(d) Here we represent class intervals along x-axis and frequency along y-axis and prepare the histogram as shown here.
Que-5: Given below are the marks obtained by 40 students in an examination :
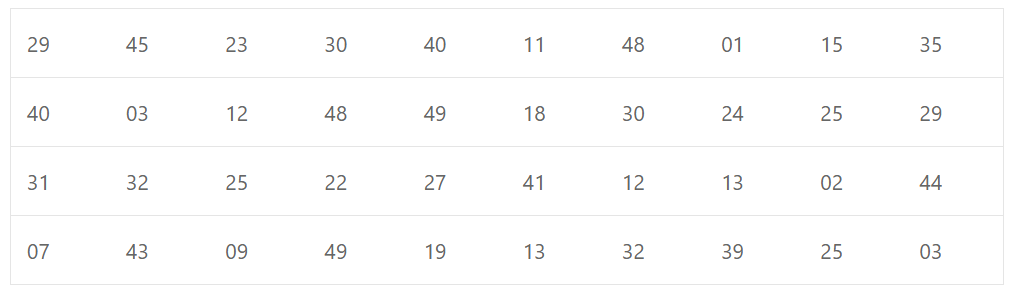
Taking class-intervals 1 – 10, 11 – 20, ………, 41 – 50, make a frequency table for the above distribution and draw a histogram to represent it.
Sol: We prepare frequency distribution table as given below :
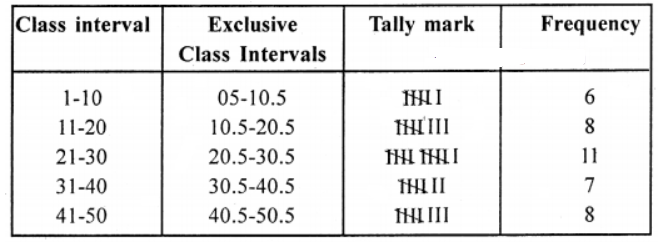
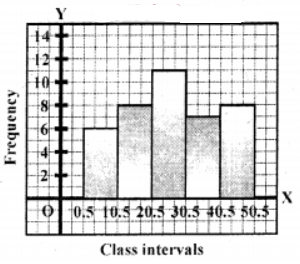
We represent class intervals (exclusive) along x-axis and frequency along y-axis and prepare the histogram to represent the above data as given below :
Que-6: Present in the form of a frequency table the marks obtained by 50 candidates. Take the class-intervals as 11 – 20; 21 – 30… etc.
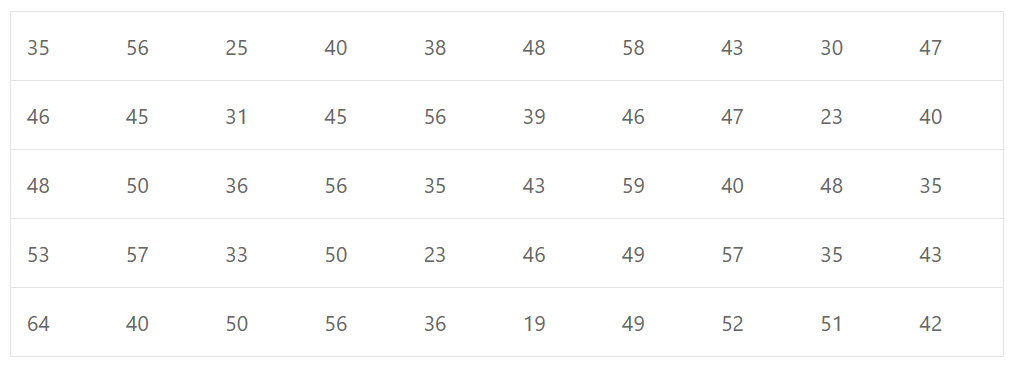
Draw a histogram for the above distribution.
Sol: Lowest data = 19,
Highest data = 64
We prepare frequency distribution table of the given data as given below :
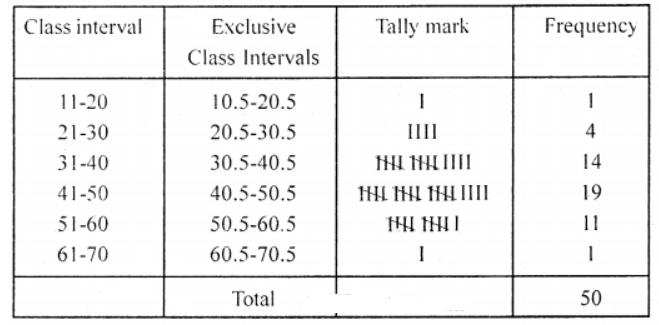
Now we represent exclusive class intervals along x-axis and frequency alongy-axis and prepare a histogram to represent the given data as shown below:
Que-7: Explain the methods of draw ing histogram and frequency polygon. Following table gives the marks distribution of 160 students in a certain class.
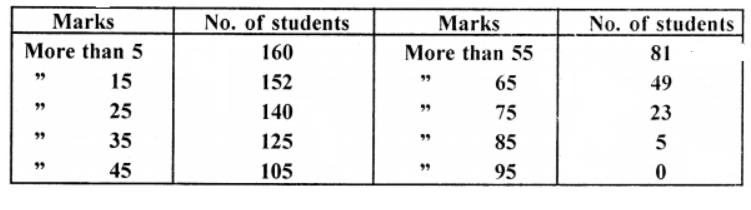
From the above data draw a histogram and frequency polygon.
Sol:
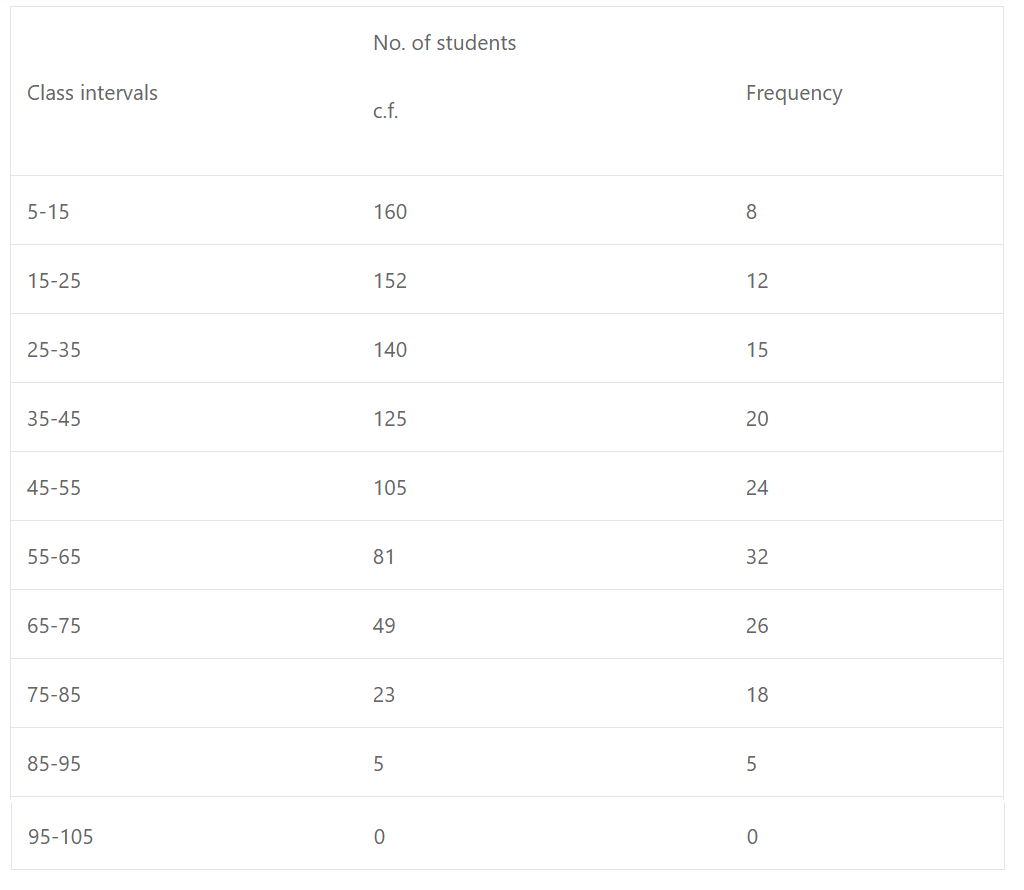
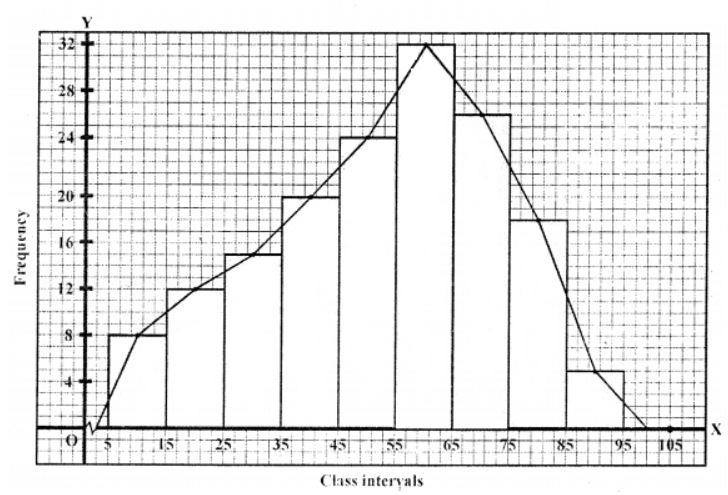
We present class intervals along x-axis and frequency alongy-axis and prepare the histogram and frequency polygon by joining the mid-points of consecutive class intervals.
Que-8: The number of match sticks in 40 boxes, on counting was found as given below
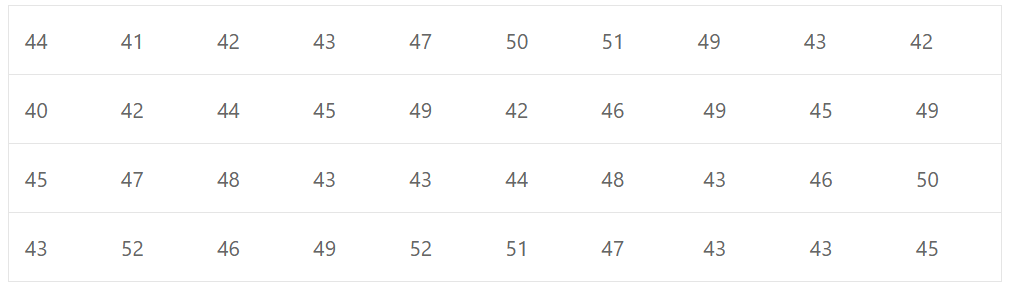
Taking classes 40 – 41, 42 – 43, etc., construct the frequency distribution table for the above data. Draw a histogram to represent the above distribution.
Sol: Highest score = 52, lowest score = 40
Now we prepare the frequency distribution table in exclusive form
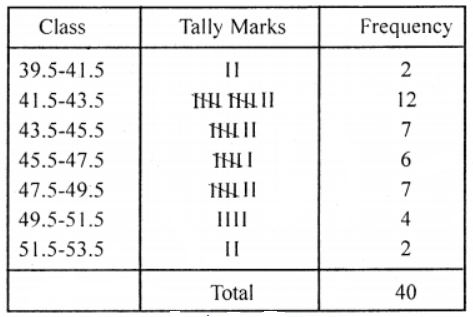
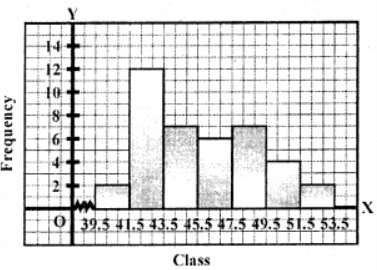
Now we represent classes along x-axis and frequencies along v-axis and prepare the histogram representing the given data :
–: End of Histogram and Ogive Class 10 OP Malhotra Exe-19A ICSE Maths Solutions Ch-19 :–
Return to : OP Malhotra S Chand Solutions for ICSE Class-10 Maths
Thanks
Please Share with Your Friends


