Motion in One Dimension Exe-2B Graphical Representation of Linear Motions Short Answer Type for Class-9 ICSE Concise Physics. There is the solutions of Short Answer type Questions of your latest textbook which is applicable in 2025-26 academic session. Visit official Website CISCE for detail information about ICSE Board Class-9.
Motion in One Dimension Exe-2 B Graphical Representation of Linear Motions Short Answer
(ICSE Class – 9 Physics Concise Selina Publishers)
| Board | ICSE |
| Class | 9 |
| Subject | Physics |
| Writer / Publication | Concise selina Publishers |
| Chapter-2 | Motion in One Dimension |
| Exe – 2 B | Graphical Representation of Linear Motions |
| Topics | Solution of Exe-2(B) Short Answer Type |
| Academic Session | 2025-2026 |
Exe-2B Graphical Representation of Linear Motions Short Answer Type
Ch-2 Motion in One Dimension Physics Class-9 ICSE Concise
Page 53
Que-1: What information about the motion of a body is obtained from the displacement-time graph?
Ans: From displacement-time graph, the nature of motion (or state of rest) can be understood. The slope of this graph gives the value of velocity of the body at any instant of time, using which the velocity-time graph can also be drawn.
Que-2: Can displacement-time sketch be parallel to the displacement axis? Give a reason to your answer.
Ans: The displacement-time graph can never be parallel to the displacement axis because such a line would mean that the distance covered by the body in a certain direction increases without any increase in time, which is not possible.
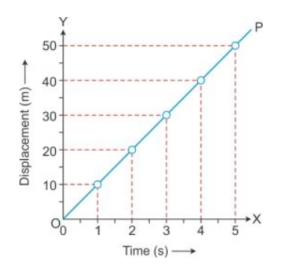
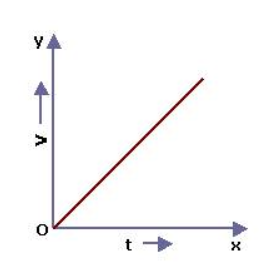
Que-3: Draw a displacement-time graph for a boy going to school with uniform velocity.
Ans:
Que-4: State how the velocity-time graph can be used to find
(i) The acceleration of a body, (ii) The distance traveled by the body in a given time and (iii) The displacement of the body in a given time.
Ans:
(i) The slope of the velocity-time graph gives the value of acceleration.
(ii) The total distance travelled by a body in a given time is given by the area enclosed between the velocity-time graph and X-axis (without any sign).
(iii) The displacement of a body in a given time is given by the area enclosed between the velocity-time graph and X-axis (with proper signs).
Que-5: What can you say about the nature of motion of a body if its displacement-time graph is
(a) A straight line parallel to the time axis?
(b) A straight line inclined to the time axis with an acute angle?
(c) A straight line inclined to the time axis with an obtuse angle?
(d) A curve.
Ans:
(a) There is no motion, the body is at rest.
(b) It depicts that the body is moving away from the starting point with uniform velocity.
(c) depicts that the body is moving towards the starting point with uniform velocity.
(d) It depicts that the body is moving with variable velocity.
Que-6: Fig shows the displacement-time graph of two vehicles A and B moving along a straight road. Which vehicle is moving faster? Give reason.
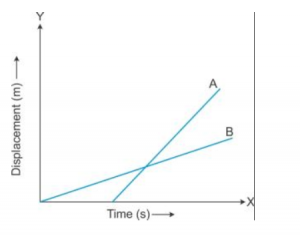
Answer : Vehicle A is moving with a faster speed because the slope of line A is more than the slope of line B.
Que-7: How is the velocity obtained from the displacement time graph for a body moving with a varying speed in a fixed direction ?
Ans: The slope of displacement versus time graph gives the velocity.
Que-8: Draw a velocity-time graph for a body moving with an initial velocity u and uniform acceleration a. Use this graph to find the distance travelled by the body in time t.
Ans:

In this graph, initial velocity = u
Velocity at time t = v
Let acceleration be ‘a’
Time = t
Then, distance travelled by the body in t s = area between the v-t graph and X-axis
Or distance travelled by the body in t s = area of the trapezium OABD
= (1/2) × (sum of parallel sides) × (perpendicular distance between them)
= (1/2) × (u + v) × (t)
= (u + v)t /2
Que-9: State the type of motion represented by the following sketches in (a) and (b).

Give an example of each type of motion.
Ans:
(a) represents uniformly accelerated motion. For example, the motion of a freely falling object.
(b) It represents motion with variable retardation. For example, a car approaching its destination.
Que-10: The Fig. shows the velocity-time graphs for two cars A and B moving in the same direction. Which car has greater acceleration? Give reasons to your answer.
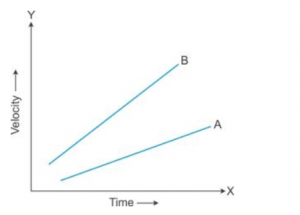
Ans: Car B has greater acceleration because the slope of line B is more than the slope of line A.
Que-11: Draw the shape of the velocity-time graph for a body moving with (a) Uniform velocity and (b) Uniform acceleration.
Ans :
Velocity-time for a body moving with uniform velocity and uniform acceleration.
Que-12: The velocity-time graph for a uniformly retarded body is a straight line inclined to the time axis with an obtuse angle. How is retardation calculated from the velocity-time graph?
Ans: Retardation is calculated by finding the negative slope.
Que-13: The figure shows the displacement – time graph for four bodies A, B C and D. In each case state what information do you get about the acceleration (zero, positive or negative).

Ans:
A: The graph is a straight line. So, the slope gives constant velocity. Hence, the acceleration for body A is zero.
B: The graph is a straight line. So, the slope gives constant velocity. Hence, the acceleration for body B is also zero.
C: The slope of the graph is decreasing with time. Hence, the acceleration is negative.
D: The slope of the graph is increasing with time. Hence, the acceleration is positive.
Exe-2B Graphical Representation of Linear Motions Short Answer Type
Ch-2 Motion in One Dimension Physics Class-9 ICSE Concise
Page 54
Que-14: Draw a graph for acceleration against time for a uniformly accelerated motion. How can it be used to find the change in speed in a certain interval of time?
Ans:
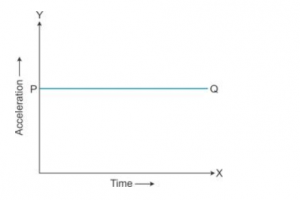
The area enclosed between the straight line and time axis for each interval of time gives the value of change in speed in that interval of time
Que-15: Draw a velocity-time graph for the free fall of a body under gravity starting from rest. Take g =10ms-2
Ans:
Que-16: How is the distance related with time for motion under uniform acceleration such as the motion of a freely falling body?
Ans: For motion under uniform acceleration, such as the motion of a freely falling body, distance is directly proportion to the square of the time
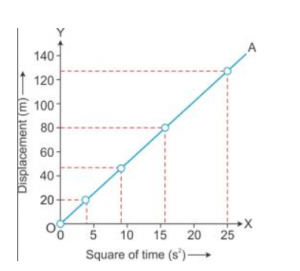
Que-17: A body falls freely from a certain height. Show graphically the relation between the distance fallen and square of time. How will you determine g from this graph?
Ans:

The value of acceleration due to gravity (g) can be obtained by doubling the slope of the graph s-t² for a freely falling body.
— : End of Motion in One Dimension Exe-2B Graphical Representation of Linear Motions Short Answer Type Solutions :–
Return to:- Concise Selina Physics ICSE Class-9 Solutions
Thanks
Please share with your friends


