Linear Regression Class 12 OP Malhotra Exe-27A ISC Maths Solutions Ch-27. In this article you would learn about scatter diagrams and general equations of regression lines. Visit official Website CISCE for detail information about ISC Board Class-12 Mathematics.

Linear Regression Class 12 OP Malhotra Exe-27A ISC Maths Solutions Ch-27
| Board | ISC |
| Publications | S Chand |
| Subject | Maths |
| Class | 12th |
| Chapter-27 | Linear Regression |
| Writer | OP Malhotra |
| Exe-27(a) | scatter diagrams and general equations of regression lines |
Scatter Diagrams and General Equations of Regression Lines
Class 12 OP Malhotra Exe-27A ISC Maths Solutions
Que-1:Determine the equation of a straight line which best fits the data:
X |
10 |
12 |
13 |
15 |
17 |
20 |
25 |
y |
10 |
22 |
24 |
27 |
29 |
33 |
37 |
Sol: Let X = x – 15 ;Y = y – 25 and let the line of best fit be Y = aX + b …(1)
The normal equations are; ΣY = aΣX + bn …(2)
and ΣXY = aΣX2 + bΣX …(3)
We construct the following table :
| X | X = x – 15 | Y | Y = y – 25 | x2 | XY |
| 10 | -5 | 10 | – 15 | 25 | 75 |
| 12 | -3 | 22 | -3 | 9 | 9 |
| 13 | -2 | 24 | -1 | 4 | 2 |
| 15 | 0 | 27 | 2 | 0 | 0 |
| 17 | 2 | 29 | 4 | 4 | 8 |
| 20 | 5 | 33 | 8 | 25 | 40 |
| 25 | 10 | 37 | 12 | 100 | 120 |
| ΣX = 7 | Σy = 7 | ΣX2 = 167 | ΣXY = 254 |
putting all these values in eqn. (1) and eqn. (2); we have
7 = 7a + 7b …(4)
254 = 167a + 7b …(5)
eqn. (5) – eqn. (4) gives ;
247 = 160a ⇒ a = \(\frac { 247 }{ 160 }\) = 1.54375
Que-2:Given the data
| X | 1 | 5 | 3 | 2 | 1 | 1 | 7 | 3 |
| y | 6 | 1 | 0 | 0 | 1 | 2 | 1 | 5 |
(i) Fit the regression line of y on x and hence predict y, if x = 10.
(ii) Fit the regression line of x on y and hence predict x, if y = 2.5.
Sol:
We construct the table of values is as under :
| X | Y | Xy | x2 | y2 |
| 1 | 6 | 6 | 1 | 36 |
| 5 | 1 | 5 | 25 | 1 |
| 3 | 0 | 0 | 9 | 0 |
| 2 | 0 | 0 | 4 | 0 |
| 1 | 1 | 1 | 1 | 1 |
| 1 | 2 | 2 | 1 | 4 |
| 7 | 1 | 7 | 49 | 1 |
| 3 | 5 | 15 | 9 | 25 |
| Σx = 23 | Σy = 16 | Σxy = 36 | Σx2 = 99 | Σy2 = 68 |
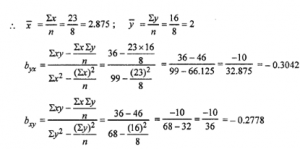 (i) Thus regression line of y on x is given by
When x = 10 ∴ from (1) ; y = 2.8745 – 3.042 = -0.13(ii) Thus, regression line of x on y is given by
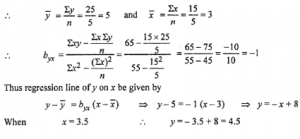
Que-3: The two lines of regression for a distribution (x, y) are 3x + 2y = 1 and x + 4y = 9. Find the regression coefficient b and b.
Sol: Given lines are 3x + 2y = 7 …(1)
and x + 4y = 9 …(2)
Assuming line (1) be the regression line of y on x
∴ 2y = 7 – 3x ⇒ y = 7/2 – (3/2)x
∴ byx = – (3/2) < 0
Then line (2) be the regression line of x on y
∴ x = 9 – 4y ⇒ byx = – 4 < 0
Now byx . bxy = (-3/2)(-4) = 6 > 1
Thus our assumption is wrong.
∴ line (1) be the regression line of x on y
∴ 3x = 7 – 2y ⇒ x = – 2/3 y + 7/3
∴ bxy = – 2/3
Then line (2) be the regression line of y on x
∴ 4y = 9 – x ⇒ y = – x/4 + 9/4
∴ byx = –1/4
Since bxy . byx = –2/3 × (−1/4) = 1/6 < 1
Hence, bxy = –2/3 and byx = – 1/4
Que-4: Given two lines of regression x + 3y = 11, 2x + y = 7, find the coefficient of correlation between x and y. Also estimate the value of x when y = 4.
Sol: Given lines are; x + 3 = 11 … (1) and 2x + y = 7 …(2)
Assuming line (1) as regression line on x on y
∴ 2x = 7 – y ⇒ x = 7/2 – (1/2) y
∴ bxy = – 1/2
Now bxybyx = (−1/2)(−1/3) =1/6 < 1
So our assumption is true.
![]()
Since r and regression coefficients have same sign
∴ r = -0.4082 [∵ bxybyx < 0]
When y = 4 ∴ from (2); 2x + 4 = 7 ⇒ x = 3/2
Que-5: (i) Out of the two regression lines x + 2y – 5 = 0,2x + 3y = 8, find the line of regression of on x.
(ii) Out of the following two regression lines, find the line of regression of x on y.
3x + 12y = 9,9x + 3y = 46.
Sol: (i) Given lines are x + 2y – 5 = 0 …(1)
and 2x + 3y = 8 …(2)
Assuming line (1) as regression line of y on x
∴ 2x = 5 – x ⇒ y = 5/2 – x/2
∴ byx = – 1/2 < 0
Then line (2) as regression line of x on y
∴ 2x = 8 – 3y ⇒ x = 4 – 3/2 y
∴ bxy = – 3/2
Since bxy . byx = 1/2 × (−3/2) = 3/4 < 1
Therefore our assumption is true.
∴ x + 2y – 5 = 0 be the regression line of y on x.
(ii) Given lines are 3x + 12y = 9 …(1)
and 9x + 3y = 46 …(2)
Assuming line (1) as regression line of y on x
∴ 12y = 9 – 3x ⇒ y = 3/4 – (1/4)x
∴ byx = – 1/4 < 0
Then line (2) be the regression line of x on y
∴ 9x = 46 – 3y ⇒ x = 46/9 – y/3
∴ bxy = – 1/3 < 0
Here byx . bxy = (−1/4) (−1/3) = 1/12 < 1
Thus our assumption is true ∴ 9x + 3y = 46 be the regression line of x on y.
Que-6: For lines of regression 4x – 2y = 3 and 2x – 3y = 5, find
(i) bxy and byx
(ii) P(x, y)
(iii) y when x = 3.
Sol: Given lines are 4x – 2y = 3 …(1)
and 2x – 3y = 5 …(2)
Assuming line (1) as regression line of x on y
∴ 4x = 2y + 3 ⇒ x = (1/2)y + 3/4
∴ bxy = 1/2 > 0
Then line (2) be the regression line of y on x
3y = 2x – 5 ∴ y = (2/3)x – 5/3
∴ byx = 2/3 > 0
Since bxy . byx = 1/2 × 2/3 = 1/3 < 1
Hence our assumption is true.
∴ line (1) be the regression line of x on y and line (2) be the regression line of y on x.
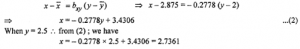
(i) ∴ bxy = 1/2 and byx = 2/3
Since ρ has same sign as regression coefficients
∴ ρ = 0.58 [∵ bxy byx > 0]
(iii) When x = 3 ∴ from (2); 3y = 2x – 5 ⇒ 3y = 6 – 5 = 1
Que-7: Find (i) x and y, (ii) byx and bxy (iii) ρ (x, y) when the two regression lines are 3x + 12y = 19, 9x + 3y = 46.
Sol: Given lines are
3x + 12y = 19 …(1)
9x + 3y = 46 …(2)
Thus, A.M be the point of intersection of line (1) are (2)
eqn. (2) – 3 × eqn. (1)
3y – 36y = 46 – 57 ⇒ – 33y = -11 ⇒ y = 1/3
∴ from(1); 3x + 4 = 19 ⇒ x = 5
Thus x̄ = 5 and ȳ = 1/3
Assuming line (1) be the regression line of y on x
∴ 12y = 19 – 3x ⇒ y = – x/y + 19/12 ∴ byx = – 1/4 < 0
Then line (2) be the regression line x on y
∴ 9x = 46 – 3y ⇒ x = – y/3 + 46/9 ∴ bxy = – 1/3 < 0
Here byx . bxy = (−1/4) (−1/3) = 1/12 < 1
Thus our assumption is true.
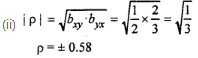
∴ bxy = – 1/3and byx = – 1/4
Since ρ has the same as regression coefficients.
∴ ρ = – 0.2886 [∵ bxy,byx < 0]
Que-8: If 4x – 5y + 33 = 0 and 20x – 9y – 107 = 0 are two lines of regression, find (i) the mean values of x and y, (ii) the regression coefficients b and b, (iii) the correlation coefficient between x and y, (iv) the standard deviation of y, if the variance of x is 9 , (v) the value of y for x = 3, (vi) the value of x for y = 2.
Sol: Given lines of regression are
4x – 5y + 33 = 0 …(1)
20x – 9y – 107 = 0 …(2)
(i) Clearly A.M be the point of intersection of lines (1) and (2).
eqn. (2) – 5 × eqn. (1); We have
-9y + 25y – 107 – 165 = 0 ⇒ 16y – 272 = 0 ⇒ y = 272/16 = 17
∴ from (1); 4x – 85 + 33 = 0 ⇒ 4x = 52 ⇒ x = 13
Thus x̄ = 13 and ȳ = 17
(ii) Assuming line (1) as regression line of y on x.
∴ 5y = 4x + 33 ⇒ y = (4/5)x + 33/5 ∴ byx =4/5 > 0
Then line (2) be the regression line of x on y
∴ 20x = 9y + 107 ⇒ x = (9/20)y + 107/20 ∴ bxy = 9/20 > 0
Here, bxy . byx = 9/20 × 4/5 = 925 < 1
Therefore our assumption is true.
∴ byx = 4/5 and bxy = 9/20
(iii) Since | ρ | = √bxy . byx = √4/3×9/20 = √9/25 = 3/5 = 0.6 ⇒ ρ = ± 0.6.
But ρ and both regression coeff’s have same sign.
∴ ρ = 0.6 [∵ bxy . byx > 0]
∴σy= 3
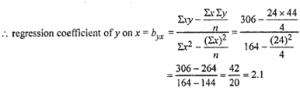
Que-9: Find the regression coefficient of y on x for the following data:
Σx = 24, Σy = 44, Σxy = 306, Σx2 = 164, Σy2 = 574, n = 4.
Sol: Given Σx = 4; Σy = 44; Σxy = 306; Σx2 = 164, Σy2 = 574, n = 4.
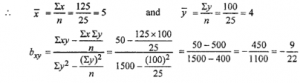
Que-10: For observation of pairs (x, y) of the variables X and Y, the following results are obtained. Σx = 125, Σy = 100, Σx2 = 1650, Σy2 = 1500, Σxy = 50 and n = 25.
Find the equation of the line of regression of x on y. Estimate the value of x if y = 5.
Sol: Given Σx = 125, Σy = 100, Σx2 = 1650, Σy2 = 1500, Σxy = 50 and n = 25
Thus regression line of x on y is given by x – x̄ = bxy (y – ȳ)
⇒ x – 5 = – (9/22)(y – 4) ⇒ 22x – 110 = – 9y + 36 ⇒ 22x = -9y = 146 …(1)
when y = 5 ∴ from (1); 22x = – 45 + 146 = 101 ⇒ x = 101/22 = 4.591
Que-11: For a bivariate data, you are given the following information :
Find (i) two lines of regression (ii) coefficient of-correlation between x and y.
Sol: Let u = x – 58 and v = y – 58
∴Σu = 46; Σu2 = 3086; Σv = 9; Σv2 = 483 ; Σuv = 1095 and n = 7
(i) Thus expression line of y on x be given by
y – ȳ = byx (x – x̄) ⇒ y – 59.29 = 0.3721 (x – 64.57)
and Regression line of x on y be given by
x – x̄ = bxy (y – ȳ) ⇒ x – 64.57 = 2.197 (y – 59.29)
(ii) Since |ρ| = √bxy . byx = √0.3721×2.197 = √0.8175 = 0.9042 ⇒ ρ = ± 0.9042
But ρ and regression coeff’s have same sign.
∴ ρ = 0.9042 [∵ bxy byx > 0]
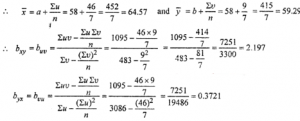
Que-12: Find the equation of two lines of regression for the data:
| X | 1 | 2 | 3 | 4 | 5 |
| y | 7 | 6 | 5 | 4 | 3 |
and hence find an estimate of y for x = 3.5 from the appropriate line of regression.
Sol:We construct the table of values is an under:
| x | y | xy | x2 |
| 1 | 7 | 7 | 1 |
| 2 | 6 | 12 | 4 |
| 3 | 5 | 15 | 9 |
| 4 | 4 | 16 | 16 |
| 5 | 3 | 15 | 25 |
| Σx = 15 | Σx = 25 | Σx = 65 | Σx = 55 |
Que-13: Compute Karl Pearson’s coefficient of correlation and interpret the result. Also find the line of best fit in the following table:
| X | 1 | 2 | 3 | 4 | 5 |
| y | 3 | 1 | 2 | 5 | 4 |
Sol: We construct the table of values is given as under:
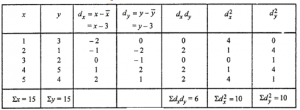
Here Σxn=x¯ ⇒ x̄ = 15/5 = 3 and ȳ = Σyn = 15/5 = 3
Karl Parson’s coefficient of correlation ρ (x, y) = Σdxdy/√Σ(dx)²√Σ(dy)² = 6/√10√10 = 6/10 = 0.6
So there is a substantial relationship between y and x.
Thus the line of best fit be given by y – ȳ = Σdxdy/Σ(dx)²(x−x¯) ⇒ y – 3 = (6/10)(x – 3)
⇒ 10y – 30 = 6x – 18 ⇒ 10y = 6x + 12 ⇒ 5y = 3x + 6
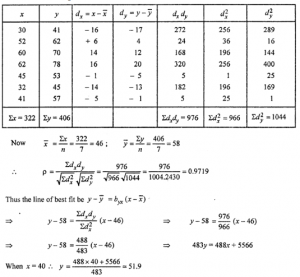
Que-14: The marks for seven candidates in an Intelligence test
| Candidate | A | B | C | D | E | F | G |
| Intelligence test | 30 | 52 | 60 | 62 | 45 | 32 | 41 |
| Arithmetic test | 41 | 62 | 70 | 78 | 53 | 45 | 57 |
Calculate Karl Pearson’s coefficient for Correlation and interpret it.
Also find a line of best fit.
A candidate X scored 40 at the Intelligence Test but was absent from the Arithmetic Test.
Estimate his probable score for the latter test.
Sol: The table of values is given as under :
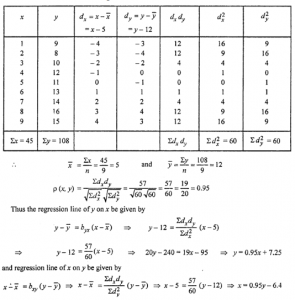
Que-15: From the following data find Karl Pearson’s coefficient of Correlation and obtain the two regression lines
| X | 1 | 2 | 3 | 4 | 5 | 6 | 7 | 8 | 9 |
| y | 9 | 8 | 10 | 12 | 11 | 13 | 14 | 16 | 15 |
Sol: We construct the table of values is given as under:
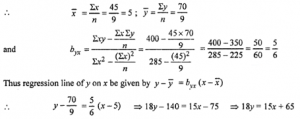
Que-16: Find the equation of the regression line of y on x, if the observations (x, y) are the following (1,4),(2,8),(3,2),(4,12),(5,10),(6,4),(7,6),(8,6),(9,18).
Sol: We construct the table of values is as under :
Here n = 9
| X | Y | Xy | X2 |
| 1 | 4 | 4 | 1 |
| 2 | 8 | 16 | 4 |
| 3 | 2 | 6 | 9 |
| 4 | 12 | 48 | 16 |
| 5 | 10 | 50 | 25 |
| 6 | 4 | 24 | 36 |
| 7 | 6 | 42 | 49 |
| 8 | 6 | 48 | 64 |
| 9 | 18 | 162 | 81 |
| Σx = 45 | Σy = 70 | Σxy = 400 | x2 = 285 |
Que-17: (i) Consider the observations (1,2),(2,4),(3,8),(4,7),(5,10,(6,5),(7,14),(8,16),(9,2), (10,20) of the corresponding values of x and y. Use the least square line of regression to predict.
(a) The value of y when that of x is 6.5.
(b) The value of x when that of y is 9.
(ii) Find the coefficient of correlation between x and y.
Sol: (i) Let the regression line of y on x be given by
y = ax + b …(1)
and normal eqns. are ; Σy = aΣx = bn ….(2)
Σxy = aΣx2 + bΣx ….(3)
The table of values is given as under:
| x | y | xy | x2 | y2 |
| 1 | 2 | 2 | 1 | 4 |
| 2 | 4 | 8 | 4 | 16 |
| 3 | 8 | 24 | 9 | 64 |
| 4 | 7 | 28 | 16 | 49 |
| 5 | 10 | 50 | 25 | 100 |
| 6 | 5 | 30 | 36 | 25 |
| 7 | 14 | 98 | 49 | 196 |
| 8 | 16 | 128 | 64 | 256 |
| 9 | 2 | 18 | 81 | 4 |
| 10 | 20 | 200 | 100 | 400 |
| Σx = 55 | Σy = 88 | Σxy = 586 | Σx2 = 385 | Σy2 = 1114 |
putting the values in eqns. (2) and (3); we have
88 = 55a + 10b …(4)
586 = 385a + 55b ….(5)
eqn. (5) – 7 × eqn. (4) gives;
586 – 616 = 55b – 70b ⇒ – 30 = – 15b ⇒ b = 2
∴ from (4); 88 = 55a + 20 ⇒ 55a = 68 ⇒ a = 68/55
∴ from (1); y = 68/55 x + 2
when x = 65; y = 68/55 × 6.5 + 2 = 10.56 and byx = 6855 > 0
Let the regression line of x on y be ; x = cy + d …(6)
and normal eqns. are ; Σx = cΣy + 10d …(7)
Σxy = cΣy² + dΣy …(8)
putting the values in eqn. (7) and (8); we have
55 = 88c + 10d …(9)
586 = 1114c + 88d
⇒ 293 = 557c + 44d …(10)
On solving eqn. (9) and eqn. (10); we have
c = 0.3004 ; d = 2.85648
∴ from (6) ; x = (0.3004)y + 2.85648
bxy = 0.3004
When y = 9 ; x = 5.56
and ρ = √bxy byx = √6855×0.3004 = √0.3714 = 0.6094
Que-18: Find the regression coefficients b and b of y on x and x on y respectively, if standard deviations of x and y are 4 and 3 respectively and coefficient of correlation between x and y is 0.8.
Sol: Given σx = 4 and σy = 3 and ρ = 0.8
∴ bxy = r(σx/σy) = 0.8 × 43 = 1.07
and byx = r(σy/σx) = 0.8 × 34 = 0.6
Que-19: The correlation coefficient between x and y is 0.60 . If the variance of x = 225, the variance of y = 400, mean of x = 10 and mean of y = 20, find the equation of the regression lines of (i) y on x, (ii) x on y.
Sol: Var (x) = (σx)² = 225 ⇒ σx = 15
Var (y) = (σy)² = 400 ⇒ σy = 20 and x̄ = 10; ȳ = 20
Also coefficient of correlation ρ = 0.6
∴ bxy = ρ(σx/σy) = 0.6 × 15/20 = 0.6 × 3/4 = 0.45
and bxy = ρ(σy/σx) = 0.6 × 20/15 = 0.6 × 4/3 = 0.8
Thus regression line of y on x be given by
y – ȳ = bxy (x – x̄) ⇒ y – 20 = 0.8 (x – 10) ⇒ y = 0.3x + 12
The regression line of x on y is given by
x – x̄ = byx (y – ȳ) ⇒ x – 10 = 0.45 (y – 20) ⇒ x = 0.45y + 1
Que-20: The regression lines of y on x and x on y are respectively given as :
y = x + 5 and 16x = 9y + 95. If σy = 4, then find the value of x̄, ȳ σy and rxy. Also, find the estimate of (i) x when y = 12, (ii) y when x = 30.
Sol: The regression line of y on x be y = x + 15 …(1)
∴ byx = 1 > 0
The regression line of x on y be 16x = 9y + 95 …(1)
⇒ x = (9/16)y + 95/16 ∴ bxy = 9/16 > 0
∴ |rxy|= √bxy⋅byx = 9/16×1 = 3/4 = 0.75 ⇒ rxy =±0.75
Since rxy has the same sign as both regression coefficients
∴ rxy = + 0.75 [∵ bxy , byx > 0]
since bxy = 1 ⇒ 1 = r(σy/σx) ⇒ 1 = 0.75 × 4σx ⇒ σx = 3
x̄ and ȳ can be found out by finding the point of interseccion (1) and (2).
From (1) and (2); we have
16x = 9 (x + 5) + 95 ⇒ 7x = 140 ⇒ x = 20
∴ from (1); y = 20 + 5 = 25
Thus, x̄ = 20 and ȳ = 25
When y = 12 ∴ from (2); x = 9/16 × 12 + 95/16 = 12.6875
When x = 30 ∴ from (1); y = 30 + 5 = 35
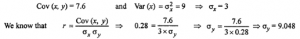
Que-21: Karl Pearson’s coefficient of correlation between two variables x and y is 0.28 , their co-variance is + 7.6 . If the variance of x is 9 , find the standard deviation of y-series.
Sol: Given Karl pearson coeff. of correlation = 0.28
Que-22: You are given the following data:
| Series | X | Y |
| Mean Standard deviation |
6 4 |
8 12 |
Coefficient of correlation = 2/3. Find : (i) The regression coefficients byx and bxy, (ii) The lines of regression, (iii) The most likely value of y when x = 10.
Sol: Given x̄ = 6; ȳ = 8 ; σx = 4; σy = 6
and r = coeff. of correlation = 2/3
(i)byx = r(σy/σx) = 2/3 × 6/4 = 12/12 = 1
bxy =r(σy/σx) = 2/3 × 4/6 = 8/18 = 4/9
(ii) regression line of x on y is given by
x – x̄ = bxy (y – ȳ) ⇒ x – 6 = 4/9 (y – 8) ⇒ 9x – 54 = 4y – 32
⇒ 9x = 4y + 22 ⇒ x = 1/9 (4y + 22) …(1)
When y = 14 ∴ from (1); we have
x = 1/9 (4 × 14 + 22) = 1/9 × 78 = 26/3 = 8.667
–: End of Linear Regression Class 12 OP Malhotra Exe-27A ISC Maths Solutions Ch-27 :–
Return to :- OP Malhotra ISC Class-12 S Chand Publication Maths Solutions
Please share with your friends
Thanks


9 thoughts on “Linear Regression Class 12 OP Malhotra Exe-27A ISC Maths Solutions”
The answer of question 4 is wrong it’s x=3/4 instead of x=3/2
sorry for inconvenience
update soon as 2023-24 session
Where is solution ????
wait will be upload it before sem-1 start if in syllabus
WHERE IS SOLUTION THIS CHAPTER IS IN SEMESTER 2.
Please provide the solution
now All chapter PDF solutions showing/ working
please visit again for analysis
Please provide the solution.
now All chapter PDF solutions showing/ working
please visit again for analysis