Coordinates and Graphs of Simultaneous Linear Equations Class 9 OP Malhotra Exe-20B ICSE Maths Solutions Ch-20. We Provide Step by Step Solutions / Answer of OP Malhotra Maths on Problems How to draw the graph of equation. Visit official Website CISCE for detail information about ICSE Board Class-9 Mathematics.
Coordinates and Graphs of Simultaneous Linear Equations Class 9 OP Malhotra Exe-20B ICSE Maths Solutions Ch-20
| Board | ICSE |
| Subject | Maths |
| Class | 9th |
| Chapter-20 | Coordinates and Graphs of Simultaneous Linear Equations |
| Writer | OP Malhotra |
| Exe-20B | How to draw the graph of equation. |
| Edition | 2025-2026 |
How to Draw the Graph of Equation
Coordinates and Graphs of Simultaneous Linear Equations Class 9 OP Malhotra Exe-20B ICSE Maths Solutions Ch-20
Que-1: Fill in the blanks :
(i) The graph of x = 1 is a line parallel to the ………. axis.
(ii) The graph of y = 1 is a line parallel to the ………. axis.
(iii) The equation ax + by + c = 0 (where a and b are not both zero) is called ……….. equation.
(iv) The graph of 2x = 1 is a line parallel to the ………. axis.
Sol: (i) The graph of x = 1 is a line parallel to the y-axis.
(ii) The graph of y = 1 is a line parallel to the x- axis.
(iii) The equation ax + by + c = 0 (where a and b are not both zero) is called linear equation.
(iv) The graph of 2x = 1 is a line parallel to the y- axis.
Que-2: Graph the following equations :
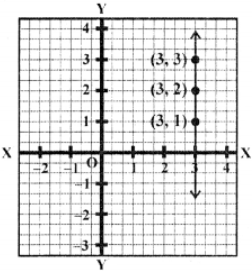
(i) x = 3
Sol: As x = 3 is a line parallel is y-axis at a distance of 3 units
Now the equation x = 3 can be written as x + 0 y = 3
Giving any values of y as 1,2, 3, etc. we get x = 3
Now plot the points (3, 1),(3, 2),(3, 3), ………… on the graph and join them to get the required line
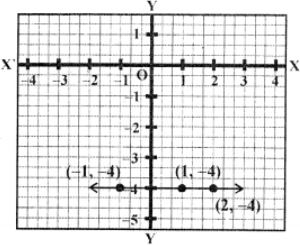
(ii) y = -4
Sol: As y = -4 is a line parallel to x-axis at a distance of -4 units. We can write this equation as 0x + y = 4
Now giving any values to x say 1,2,-1 we get y = -4
Now plot the points is (1,-4),(2,-4)(-1, -4). On the graph and join than to get the required line.
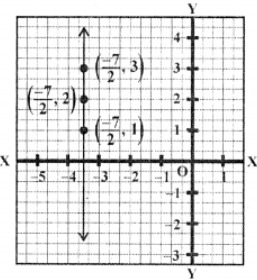
(iii) 2x = -7
Sol: As 2 x = -7 ⇒ x =−7/2 is a line parallel y-axis at a distance of −7/2. We can write it as 2x +0y = -7
Now giving some values to 1,2,3 we get 2x = -7
Now plot the points , (−7/2,1), (−7/2,3) on the graph and join them to get the required line.
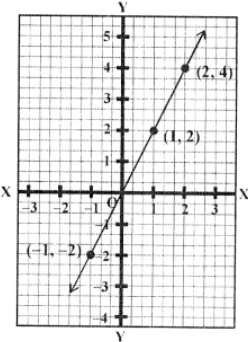
(iv) y = 2 x
Sol: y = 2 x
By giving some value to x we get the corresponding values of y as shown in the following table
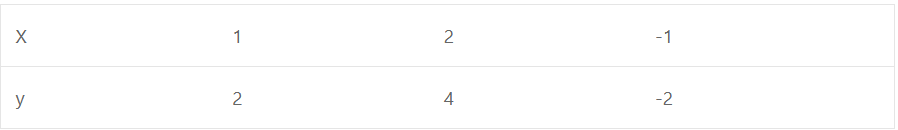
Now plot the points (1, 2),(2, 4) and (-1, -2) on the graph and join them to get the required line.
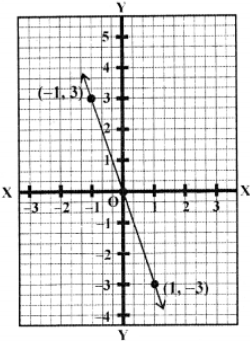
(v) y = -3x
Sol: y = -3x
By giving some values to x, we get the corresponding values of y as given below :
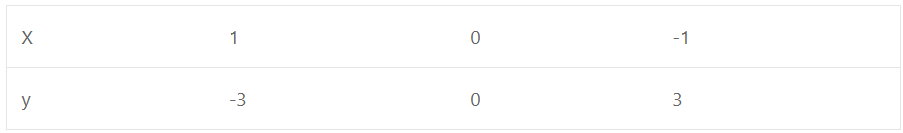
Now plot the points (1,-3),(0,0) and (-1, 3 ) on the graph and join them to get the required line
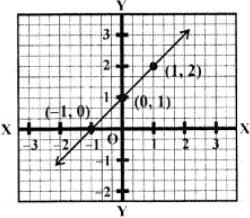
(vi) y = x + 1
Sol: y = x + 1
By giving some values to x we get the corresponding values of y as shown below :
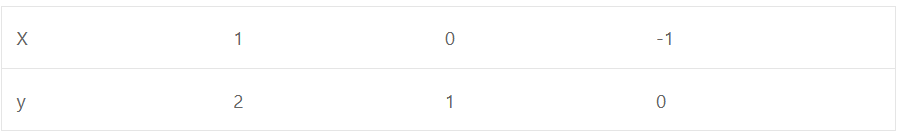
Now plot the points (1,2),(0,1) and (-1, 0 ) on the graph and join them to get the required line
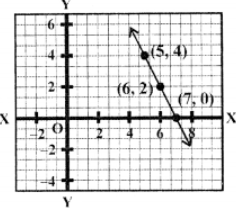
(vii) 2x + y = 14
Sol: 2x + y = 14
⇒ y = 14 – 2x
Giving some different values to x, we get corresponding values of y as given below :
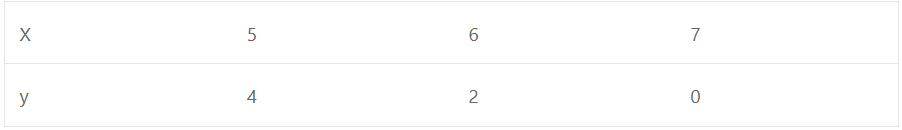
Now plot the points (5, 4),(6, 2) and (7, 0) on the graph and join them to get the required line
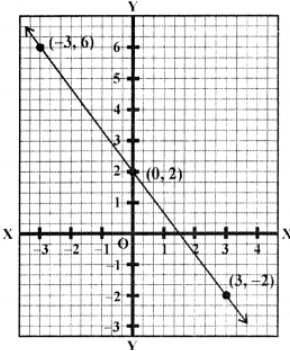
(viii) 4x + 3y = 6
Sol: 4x + 3y = 6
⇒ 4x = 6 – 3y
⇒ x = (6−3y)/4
Giving some different values to y we get corresponding values of x as given below :
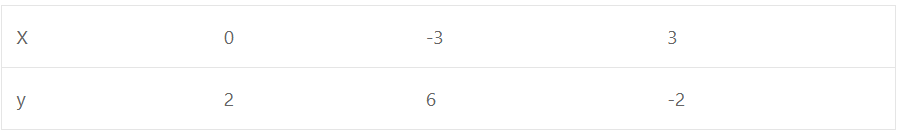
Now plot the points (0,2),(-3,6) and (3, -2 ) on the graph and join them to get the required line
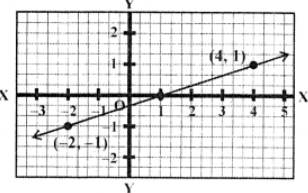
(ix) x = 3y + 1
Sol: x = 3y + 1
Giving some different values to y, we get corresponding values of x as given below :
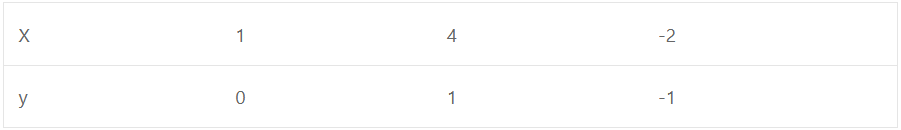
Now plot the points (1, 0),(4, 1) and (-2, -1) on the graph and join them to get the required line.
Que-3: Draw the graph of equation y = 3x – 4. Find graphically
(i) the values of y, when x = -1.
(ii) the value of x when y = 5.
Sol: y = 3x – 4
Giving some suitable value to x, we get the corresponding values of y as shown below:
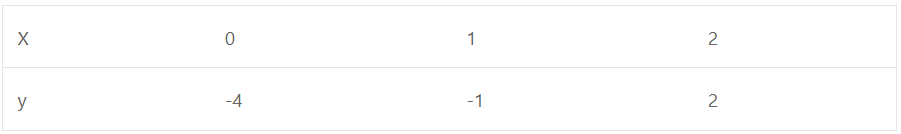
Now plot the points (0, -4),(1, -1) and (2, 2) on the graph and join than to get the required line
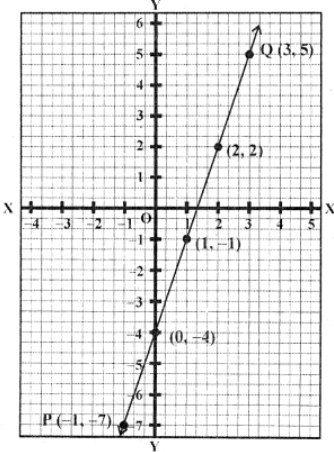
(i) From x = -1, draw a perpendicular which meet the line at P. From P draw a line || to x- axis meeting y-axis at -7
∴ If x = -1, then y = -7
(ii) Similarly from x = 5, draw a perpendicular on y-axis which meets the line at Q From Q, draw perpendicular on x-axis meeting at 3
∴ x = 3, y = 5
Que-4: Find the coordinates of the point where the following lines cut the y-axis.
(i) y = 5x + 1,
(ii) y = 3x – 7
(iii) y = x + 5,
(iv) 3y = 2x + 9.
Sol: We know that a line cuts the y-axis when x = 0
(i) ∴ y = 5 x + 1 cut the y-axis, when x = 0, When x = 0, then y = 5 × 0 + 1 = 0 + 1 = 1
∴ y = 1
∴ It will cut y-axis at (0, 1)
(ii) y = 3x – 7 will cut the y-axis when x = 0
Now, if x = 0, then y = 3 × 0 – 7 = 0 – 7 = -7
∴ It will cut y-axis at (0, -7)
(iii) y = x + 5 will cut y-axis when x = 0,
Now if x = 0, then y = 0 + 5 = 5
∴ It will cut y-axis at (0, 5)
(iv) 3y = 2x + 9 will cut y-axis when x = 0
Now if x = 0, then 3y = 2 × 0 + 9
⇒ 3y = 0 + 9 = 9
⇒ y = 9/3 = 3
∴ It will cut y-axis at (0, 3)
— : End of Coordinates and Graphs of Simultaneous Linear Equations Class 9 OP Malhotra Exe-20B ICSE Maths Solutions :–
Return to :– OP Malhotra S Chand Solutions for ICSE Class-9 Maths
Thanks
Please Share with Your Friends


