Correlation Analysis Class 11 OP Malhotra Exe-29A ISC Maths Ch-29 Solutions. In this article you would learn about Methods of Studying Correlation. Step by step solutions of latest textbook has been given as latest syllabus. Visit official Website CISCE for detail information about ISC Board Class-11 Mathematics.
Correlation Analysis Class 11 OP Malhotra Exe-29A ISC Maths Solutions Ch-29
| Board | ISC |
| Publications | S Chand |
| Subject | Maths |
| Class | 11th |
| Chapter-29 | Correlation Analysis |
| Writer | O.P. Malhotra |
| Exe-29(A) | Methods of Studying Correlation |
Methods of Studying Correlation.
Correlation Analysis Class 11 OP Malhotra Exe-29A ISC Maths Ch-29 Solutions.
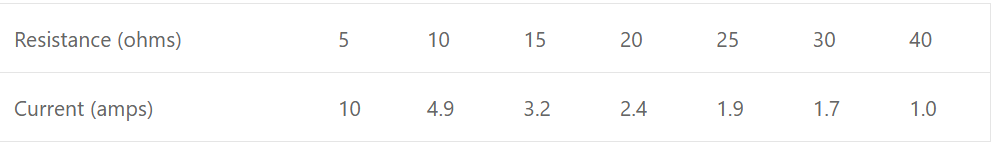
Que-1: A physicist is experimenting with the resistance in a circuit she is using. She measures and records the resulting current.
(i) Draw a scatter graph of her results.
(ii) Estimate the current for a resistance of 40 ohms.
(iii) Estimate the resistance for a current of 7.5 amps.
Sol: (i) Plot the points (5, 10), (10, 4.9), (15, 3.2), (20, 2.4), (25, 1.9), (30, 1.7) and (50, 1.0) on graph paper.
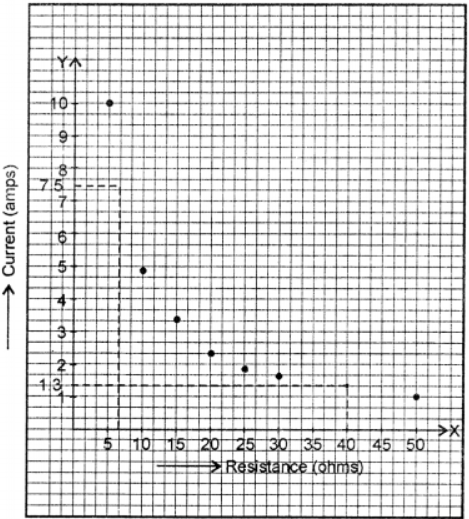
(ii) Clearly from scatter diagram, the corresponding current for a resistance of 40 ohms be 1.3 amps.
(iii) Clearly from scatter diagram, the corresponding value of resistance for current of 7.5 amps be 6.5 ohms.
Que-2: In a small survey the heights of eight boys were measured and their shoe sizes were recorded.
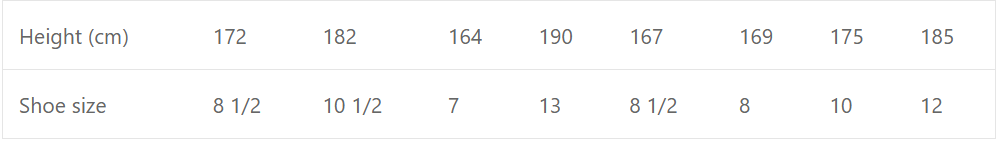
Draw a scatter graphs and use it to find out whether there is a relationship between these sets of data.
Sol:
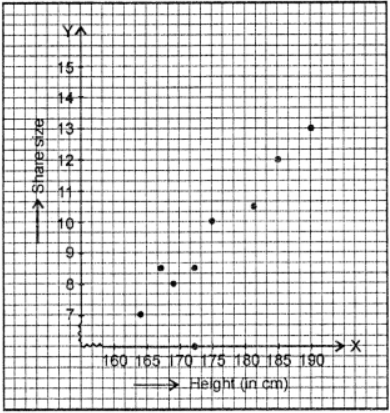
The plotted points are approximately lie along a straight line suggesting that the shoe size of a boy is related to his height.
TYPE 2. (Based on first formula : r = {Σdxdy} / √{(Σd2x)(∑d2y)}, where dx = x – x¯, dy = y – y¯)
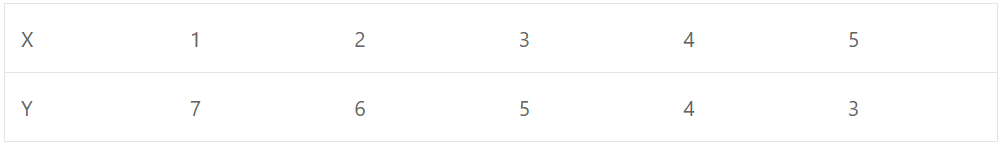
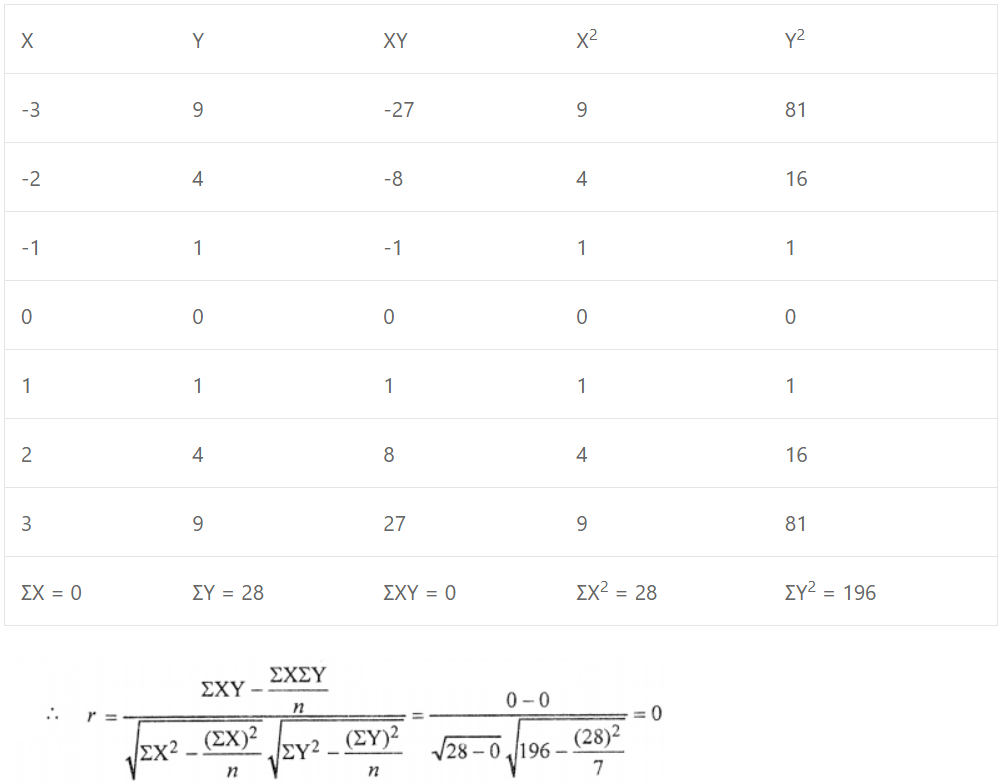
Que-3: Calculate Karl Pearson’s coefficient of correlation between the values of X and Y for the following data. Comment on the value of r.
Sol: We construct the table of values is as under:
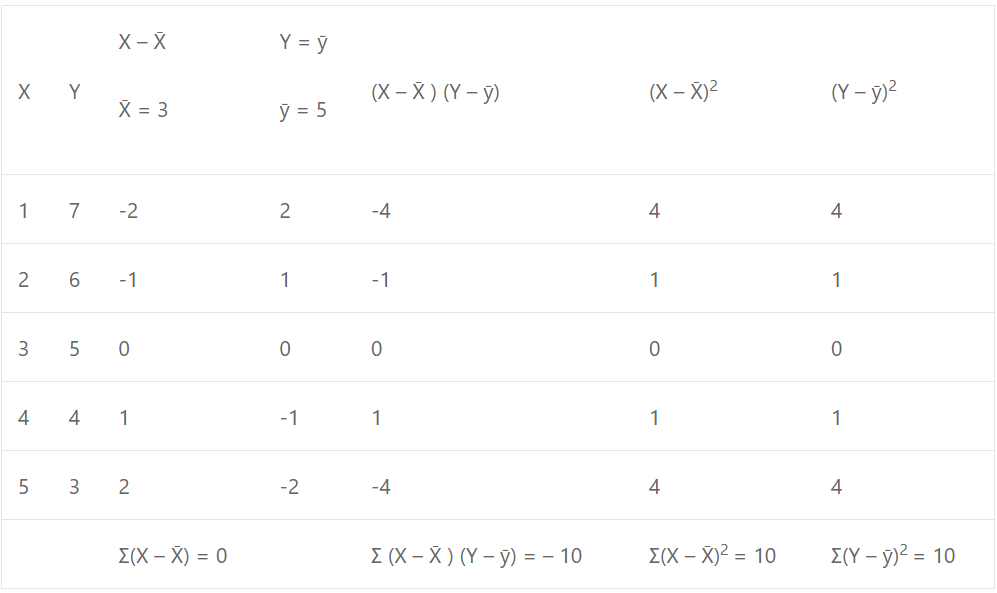
Here X¯ = (1+2+3+4+5)/5 = 15/5 = 3
and Y¯ = (7+6+5+4+3)/5 = 25/5 = 5
Thus coefficient of correlation
![]()
since r = – 1, which shows perfect negative correlation between X and Y.
Que-4:
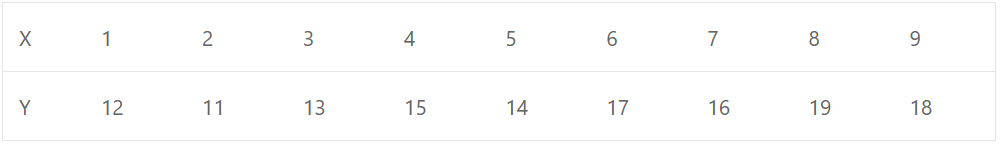
Sol: We construct the table of values is given as under :
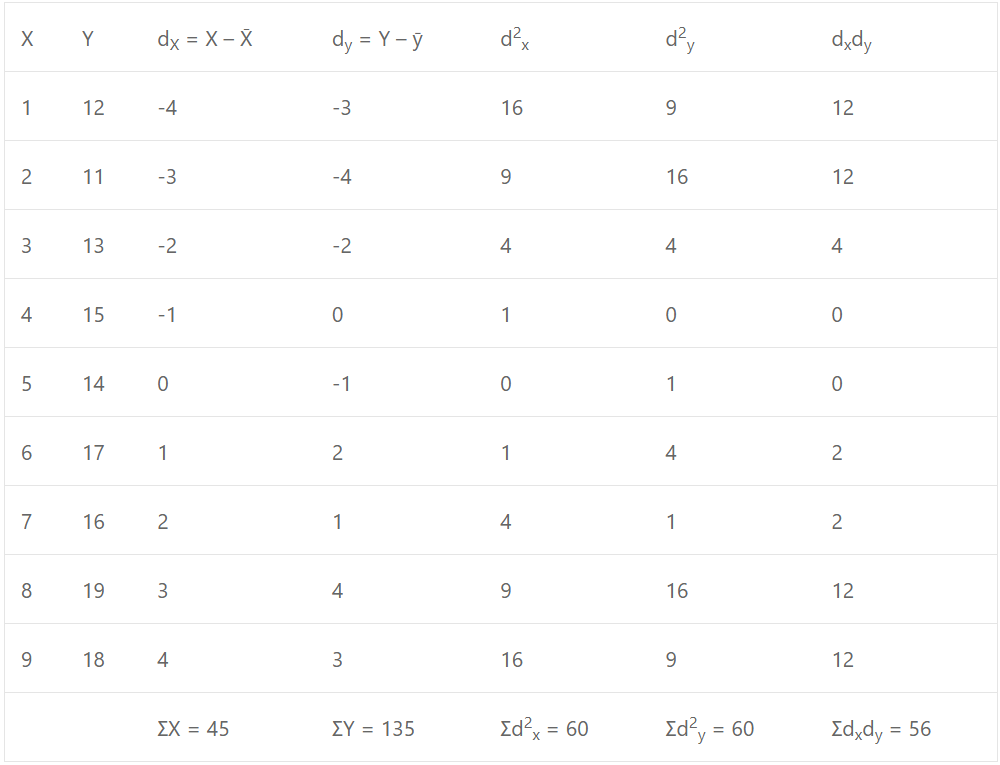
Here X¯ = ΣX/n = 45/9 = 5
and Y¯ = ΣY/n = 135/9 = 15
Karl Pearson’s coeff. of correlation r = {ΣdXdY} / √{Σd2X√Σd2Y}
= 56 / (√60√60) = 56/60 = 14/15 = 0.933
which shows that their is a high positive correlation between X and Y.
Que-5:
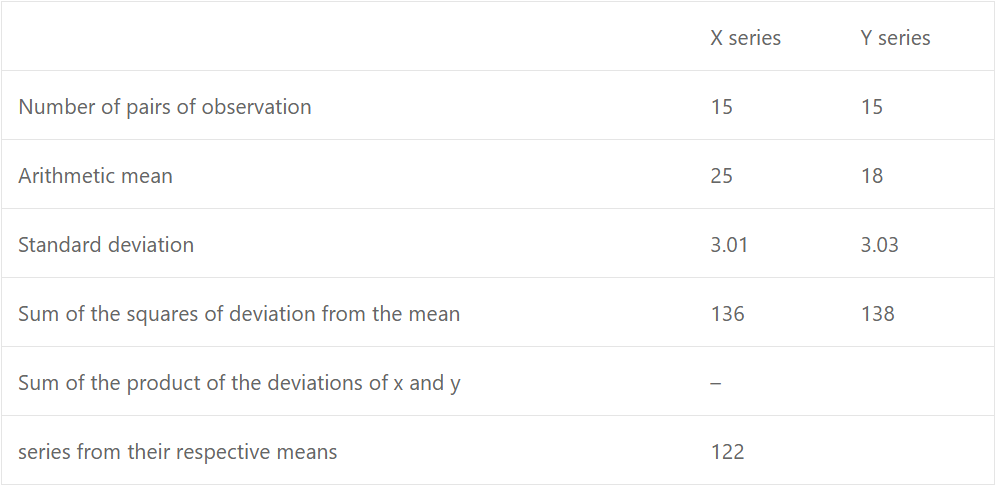
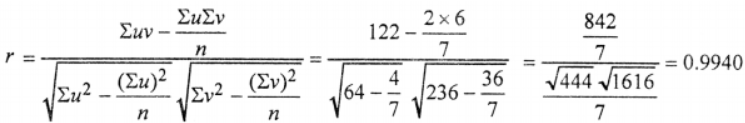
Sol: Given sum of the squares of deviation from the mean of series X=d2X=Σ(X−X¯¯¯¯)=136
d²Y = Σ(Y−Y¯)² = 138
dXdY = Σ(X−X¯)(Y−Y¯) = 122
∴ r = {ΣdXdY} / √{Σd2X√Σd2Y} = 122 / {√136√138} = 0.89
So there is high positive correlation between X and Y.
Que-6: Calculate the Pearson’s coefficient of correlation between the ages of husband and wife.
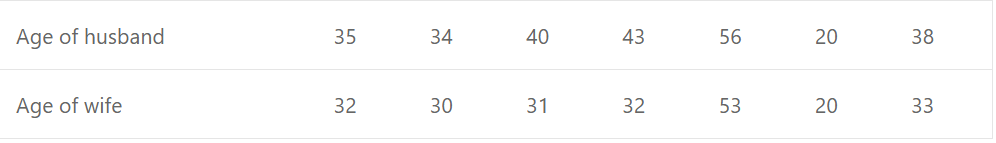
Sol: We construct the table of values is given as under :
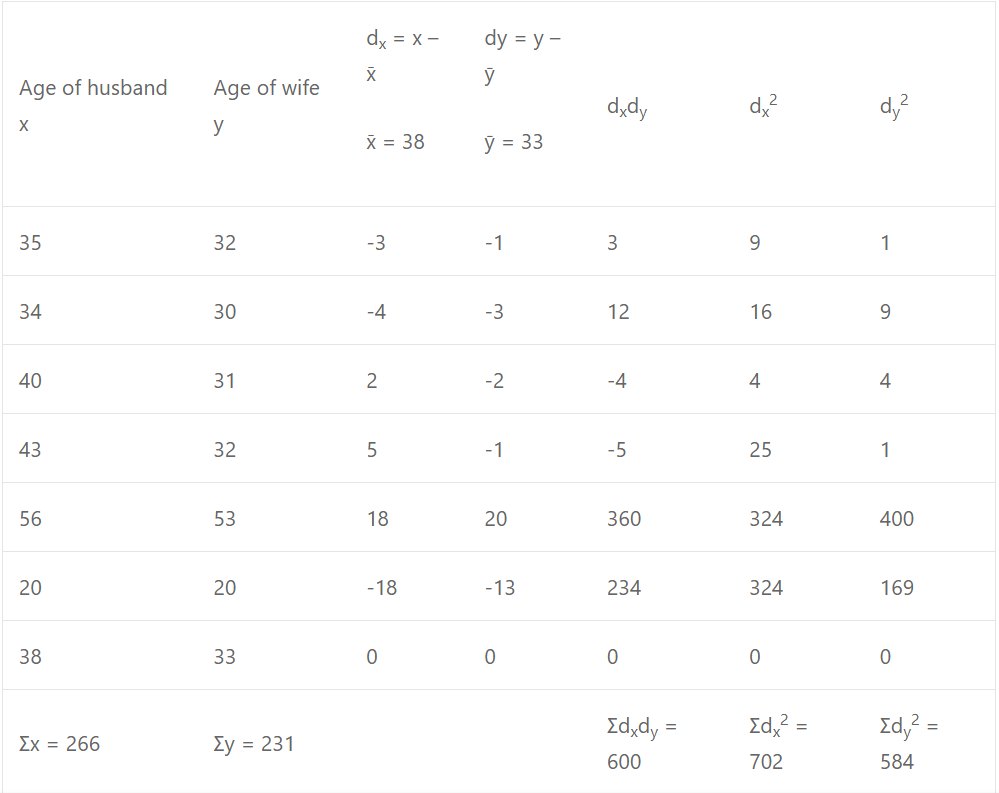
x¯ = Σx/n = 266/7 = 38
and y¯ = Σy/n = 231/7 = 33
r = {Σdxdy} / √{Σd2x√Σd2y} = 600 / {√702√584} = 0.937
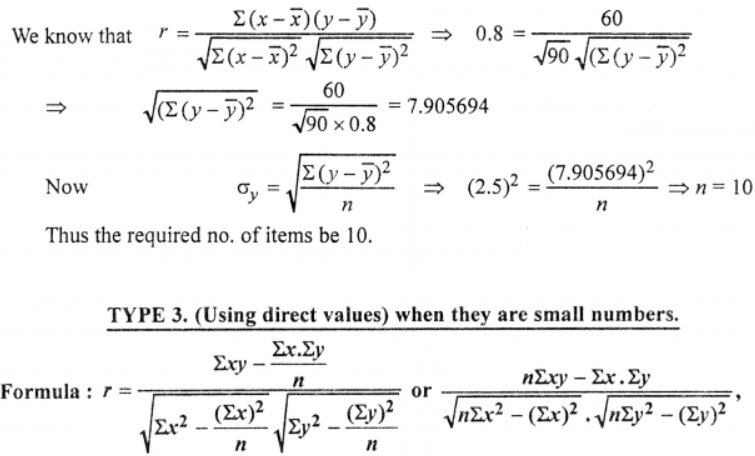
Que-7: Given r = 0.8, Σxy = 60, σy = 2.5 and Σx2 = 90, find the number of items. x and y are deviations from their respective mean.
Sol: Given r = 0.8 ; Σxy = Σ(x – x¯)(y – y¯)=60 ; σy = 2.5 ; Σx2 = Σ(x –x¯)2 = 90
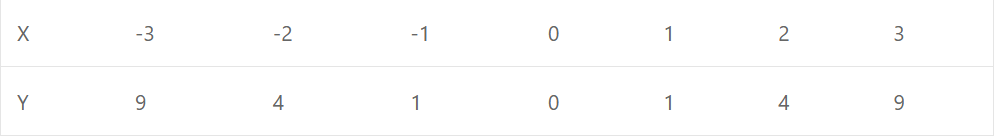
Calculate Karl Pearson’s coefficient of correlation between the values of x and y for the following data.
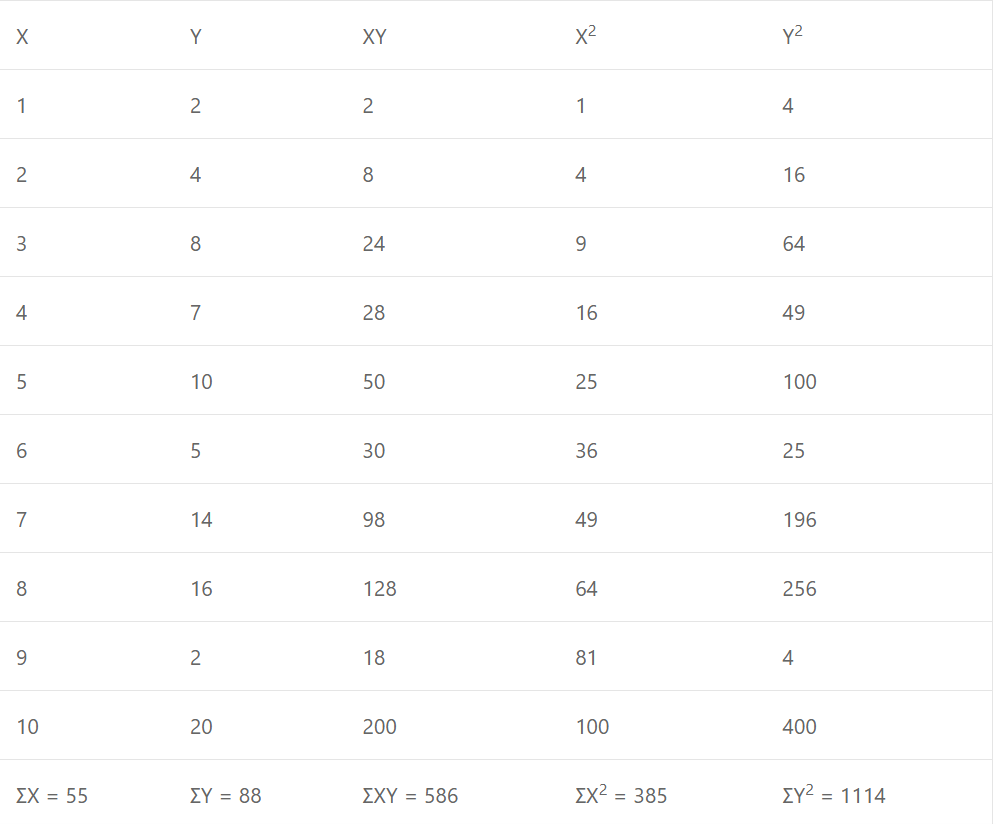
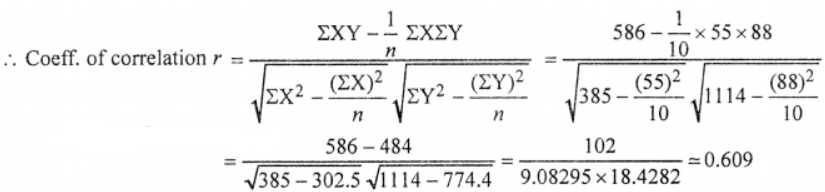
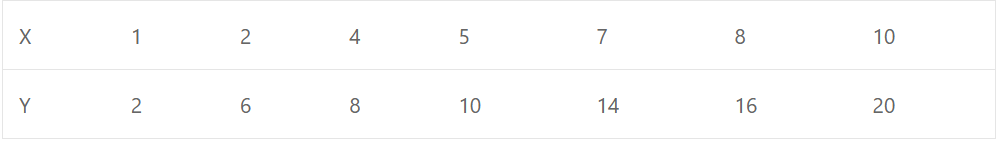
Que-8: (1,2), (2,4), (3,8), (4,7), (5,10), (6,5), (7,14), (8,16), (9,2), (10,20)
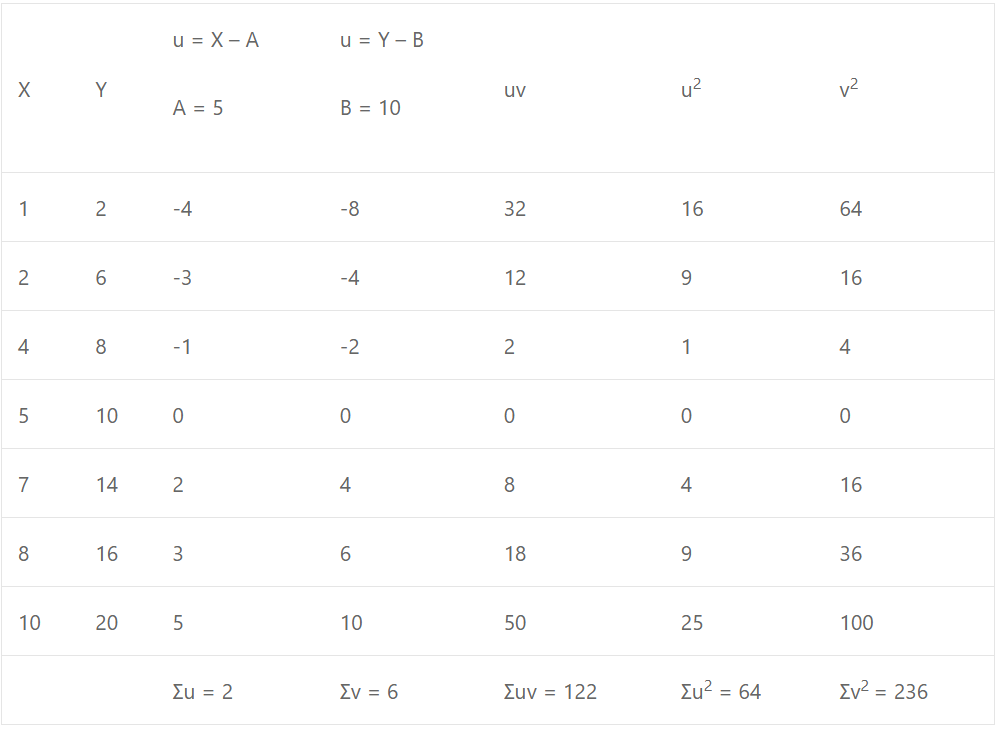
Sol: We construct the table of values is given as under :
Que-9:
Sol: We construct table of values is given as under:
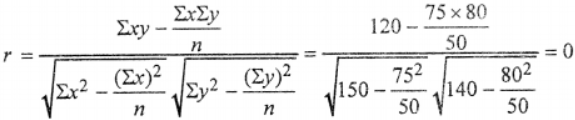
Que-10: n = 50, Σx = 75, Σy = 80, Σx2 = 150, Σy2 = 140, Σxy = 120.
Sol: Given n = 50 ; Σx = 75 ; Σy = 80 ; Σx2 = 150 ; Σy2 = 140 and Σxy = 120
Que-11: n = 10, Σx = 55, Σy = 40, Σx2 = 385, Σy2 = 192 and Σ(x + y)2 = 947.
Sol: Given n = 10 ; Σx = 55 ; Σy = 40 ; Σx2 = 385, Σy2 = 192
and Σ(x + y)2 = 947
⇒ 948 = Σ(x2 + y2 + 2xy)
⇒ 947 = Σx2 + Σy2 + 2Σxy
⇒ 947 = 385 + 192 + 2Σxy
⇒ 947 = 577 + 2Σxy
⇒ 2Σxy = 370
⇒ Σxy = 185
Coefficient of correlation
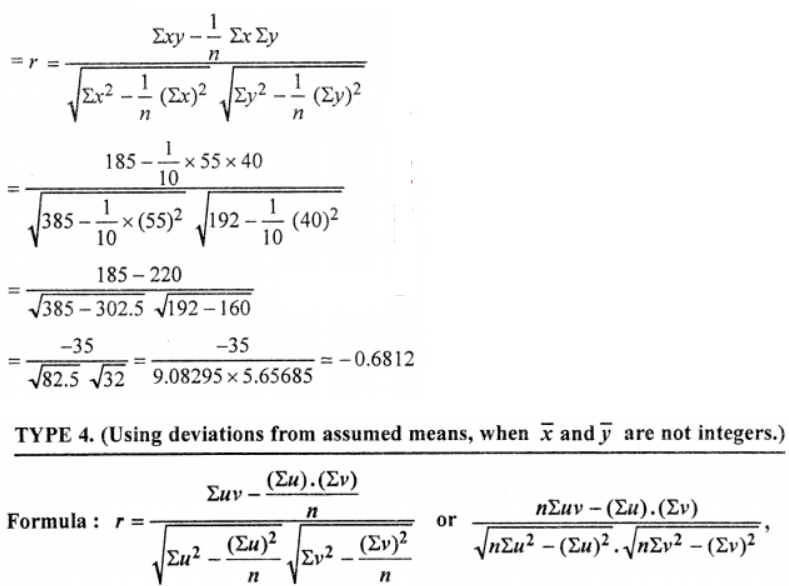
Where u = X – A or (X−A)/h, v = Y – B or (Y−B)/k, A and B being assumed means.
Que-12:
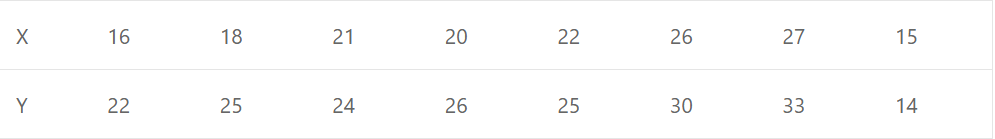
Sol: Let Assumed mean for series X be 20 i.e. A = 20 and for series Y be 25 i.e. B = 25, Here n = 8 We construct the table of values is an under:
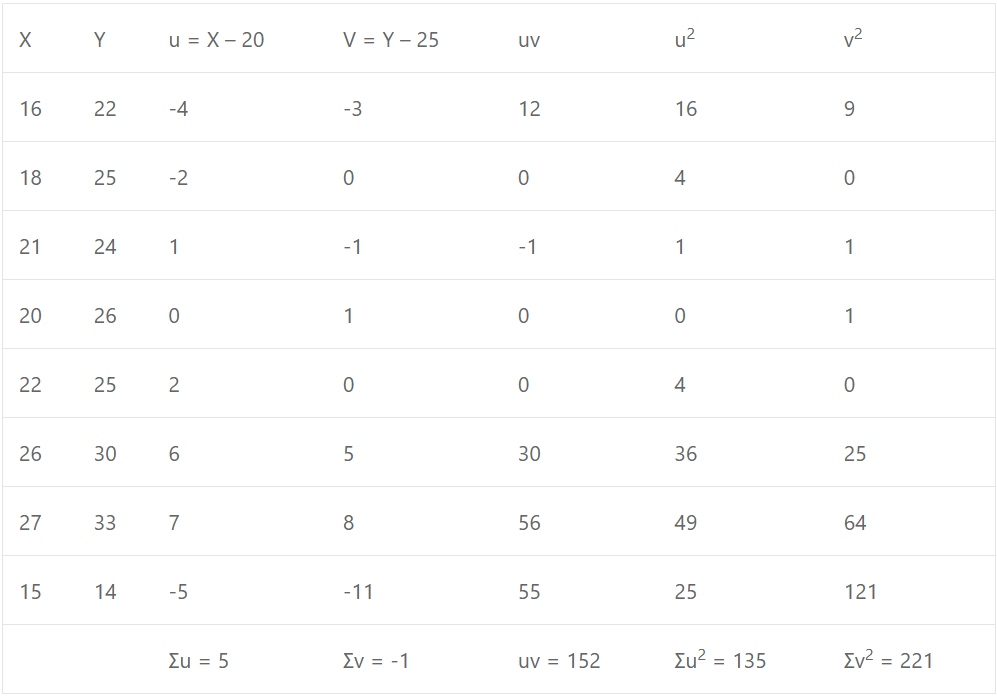
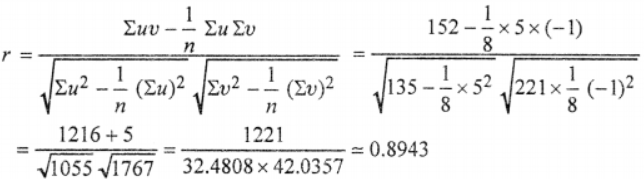
Thus using formula, we have
Que-13:
Sol:
So there is a positive and perfect correlation between X an Y.
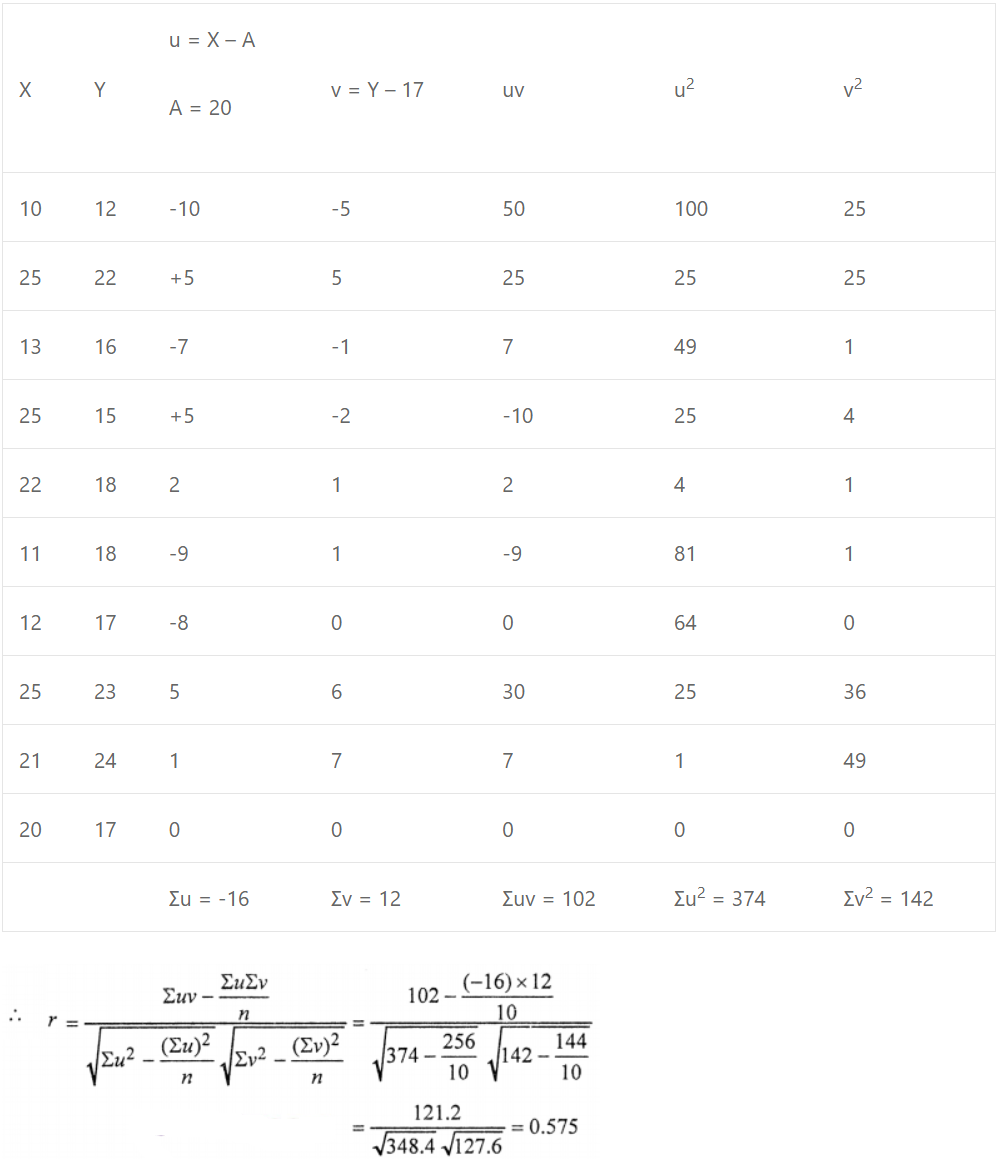
Que-14: Calculate Karl Pearson’s correlation coefficient between the marks in English and Hindi obtained by 10 students.
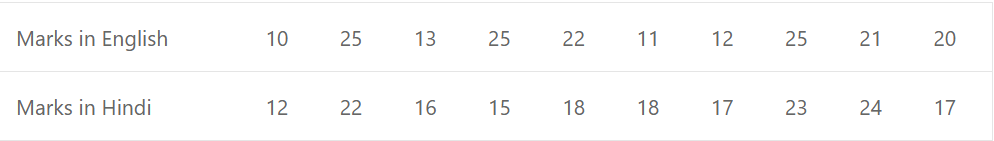
Sol: We construct the table of values is given as under :
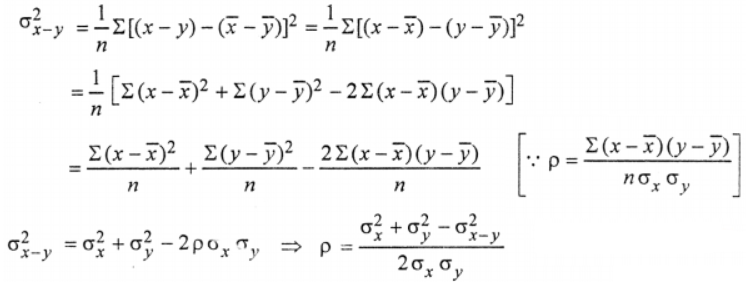
Que-15: Show that the coefficient of correlation ρ between two variables x and y is given by ρ = {σ²x+σ²y–σ²(x−y)} / (2σyσx) where σ²x,σ²y and σ²(x−y) are the variances of x, y and x-y respectively
Sol:
Que-16: A computer expert while calculating correlation coefficient between X and Y from 25 pairs of observations obtained the following results :
n = 25, ΣX = 125, ΣX2 = 650, ΣY = 100, ΣY2 = 460, ΣXY = 508
It was, however, later discovered at the time of checking that he had copied down two pairs as  while the correct values were
  Obtain the correct value of correlation coefficient.
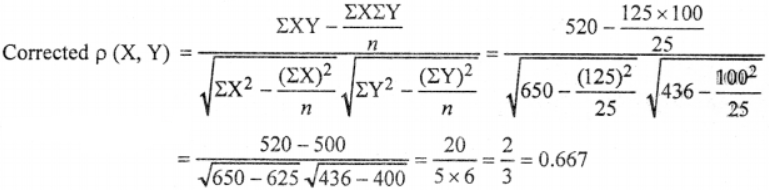
Sol: Given n = 25, ΣX = 125 ; ΣX2 = 650 ; ΣY2 = 460 ; ΣY = 100 ; ΣXY = 508
Corrected ΣX = Given ΣX – (Sum of incorrect values) + (Sum of correct values) = 125 – (6 + 8) + (8 + 6) = 125
Corrected ΣX2 = Given ΣX2 – (62 + 82) + (82 + 62) = 650 – 100 + 100 = 650
Corrected ΣXY = Given ΣXY – (6 × 14 + 8 × 6) + (8 × 12 + 6 × 8) = 508 – (84 + 48) + (96 + 48) = 520
Corrected ΣY = 100 – (14 + 6) + (12 + 8) = 100
Corrected ΣY2 = 460 – (142 + 62) +(122 + 82) = 436
Que-17: A computer obtained the data: n = 30, Σx = 120, Σy = 90, Σx2 = 600, Σy2 = 250 and Σxy = 56. Later on, it was found that pairs  are wrong while the correct values are
  Find the correct values of ρ(X, Y).
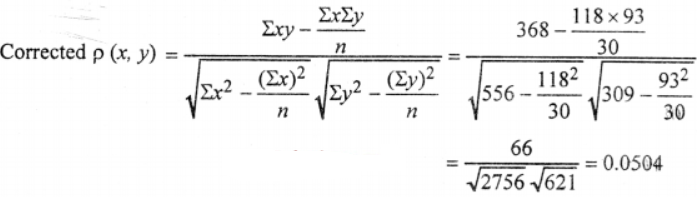
Sol: Given n = 30; Σx = 120; Σy = 90; Σx2 = 600 ; Σy2 = 250 and Σxy = 356
Corrected Σx = Given Σx – (Sum of incorrect values) + (Sum of correct values) = 120 – (8 + 12) + (8 + 10) = 118
Corrected Σx2 = 600 – (82 + 122) + (82 + 102) = 556
Corrected Σy = 90 – (10 + 7) + (12 + 8) = 93
Corrected Σy2 = 250 – (102 + 72) + (122 + 82) = 309
Corrected Σxy = 356 – (8 × 10 + 12 × 7) + (8 × 12 + 10 × 8) = 368
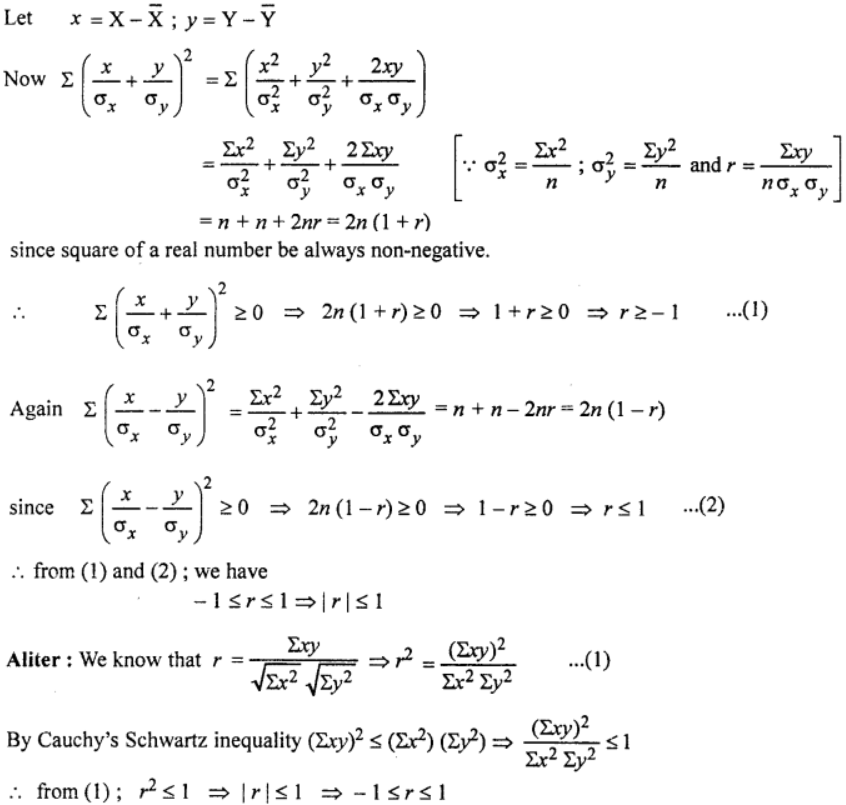
Que-18: Show that Pearson’s coefficient of correlation lies between -1 and +1 , i.e., -1 ≤ r ≤ 1 or | r | ≤ 1.
Sol:
–: End of Correlation Analysis Class 11 OP Malhotra Exe-29A ISC Maths Ch-29 Solutions. :–
Return to :- OP Malhotra ISC Class-11 S Chand Publication Maths Solutions
Please share with your friends
Thanks


