Measures of Dispersion Class 11 OP Malhotra Exe-21B ISC Maths Ch-21 Solutions. In this article you would learn about Short-Cut Method to Find The Standard Deviation. Step by step solutions of latest textbook has been given as latest syllabus. Visit official Website CISCE for detail information about ISC Board Class-11 Mathematics.
Measures of Dispersion Class 11 OP Malhotra Exe-21B ISC Maths Solutions Ch-21
| Board | ISC |
| Publications | S Chand |
| Subject | Maths |
| Class | 11th |
| Chapter-21 | Measures of Dispersion |
| Writer | O.P. Malhotra |
| Exe-21(B) | Short-Cut Method to Find The Standard Deviation |
Short-Cut Method to Find The Standard Deviation
Measures of Dispersion Class 11 OP Malhotra Exe-21B ISC Maths Ch-21 Solutions.
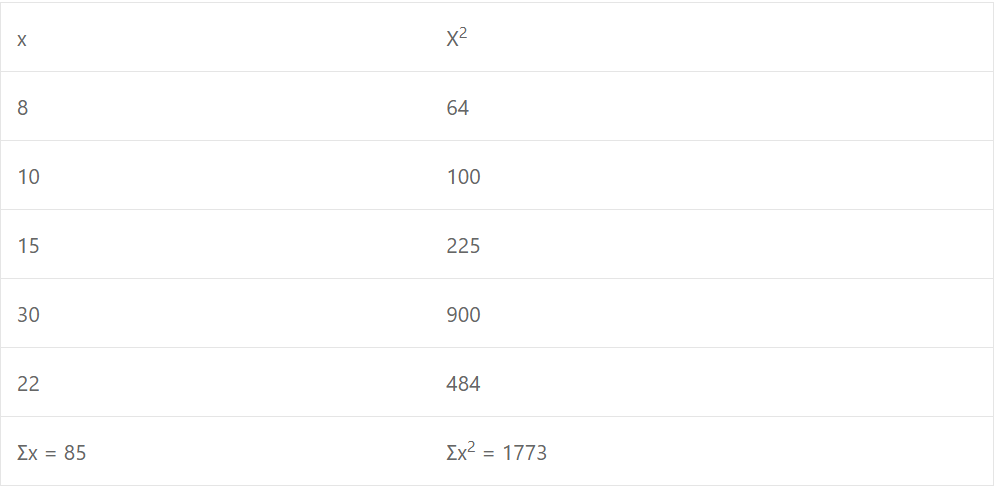
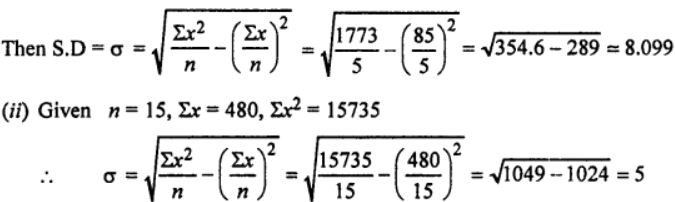
Que-1: (i) Five students secured marks as ; 8, 10, 15, 30, 22. Find the standard deviation.
(ii) For a set of ungrouped values the following sums are found :
n = 15, Σx = 480, Σx2 = 15735.
Find the standard deviation.
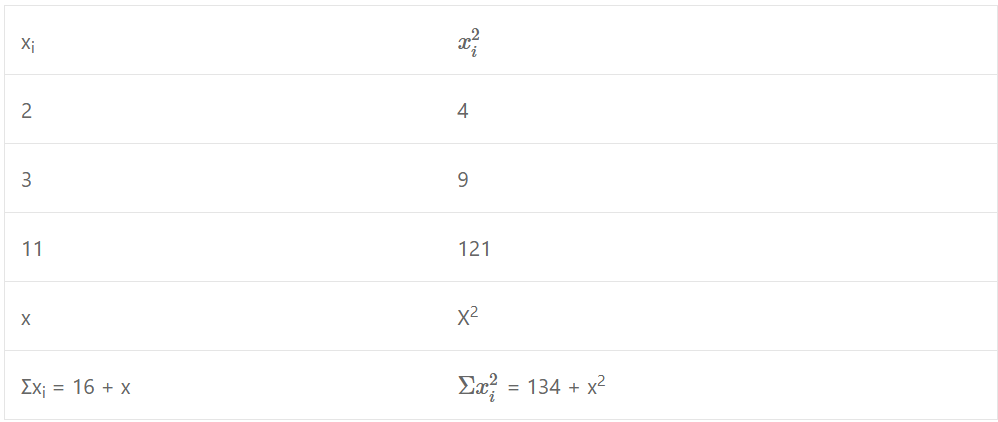
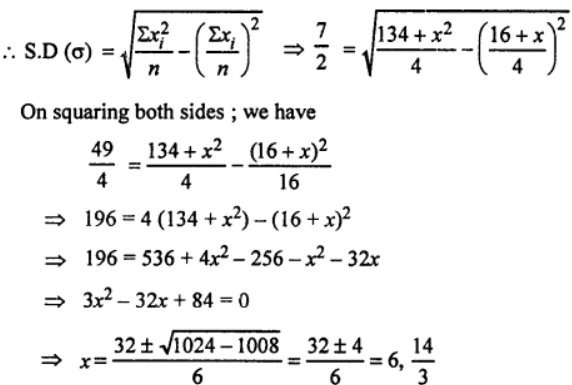
(iii) The standard deviation of the numbers 2, 3, 11, x is 3 1/2. Calculate the values of x.
Sol:
(iii)
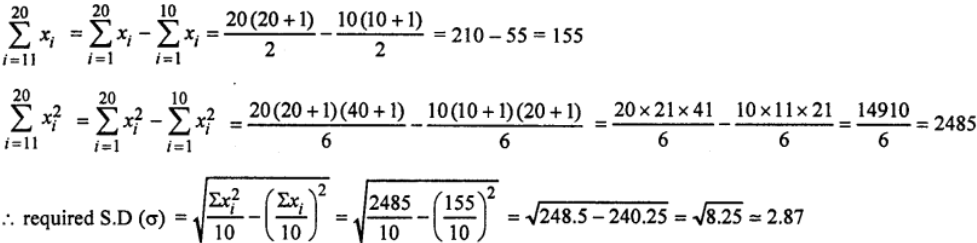
Que-2: Calculate the standard deviation and variance for the integers 11,12,13,…, 20.
Sol: Given observations are 11, 12, 13, …., 20
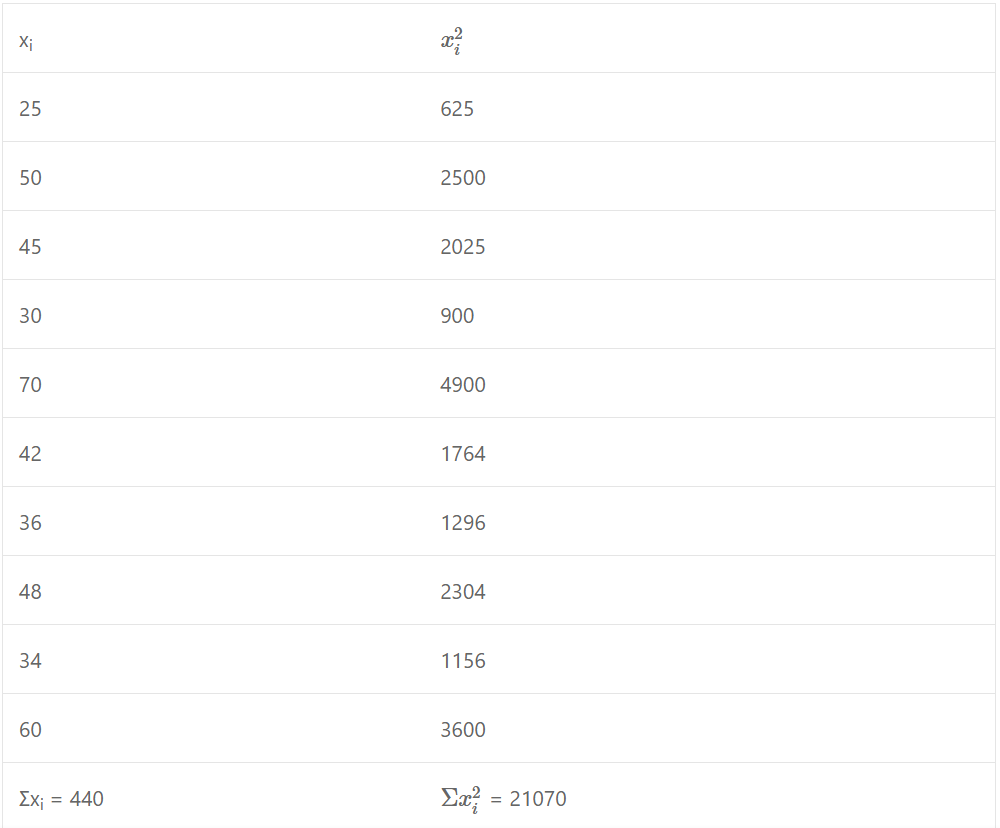
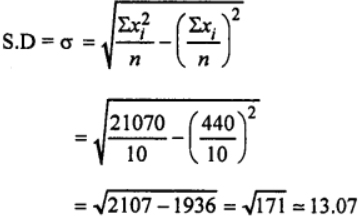
Que-3: Find the standard deviation of the following set of numbers :
25, 50, 45, 30, 70, 42, 36, 48, 34, 60
Sol:
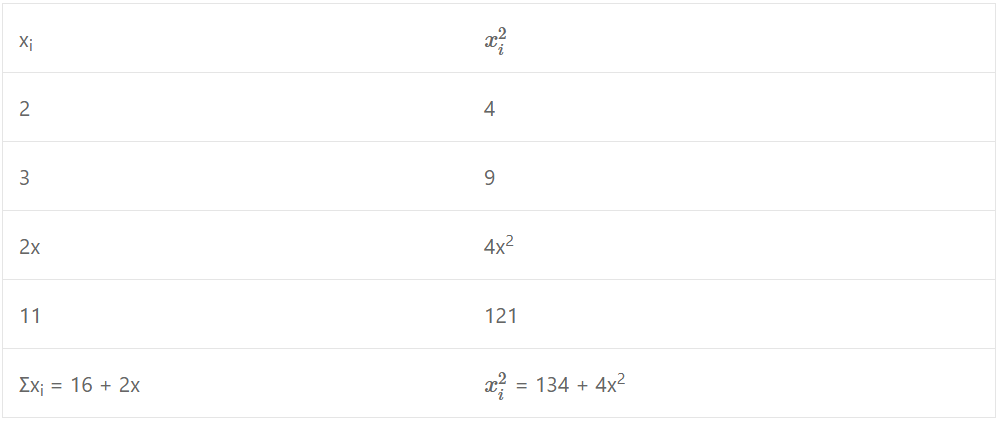
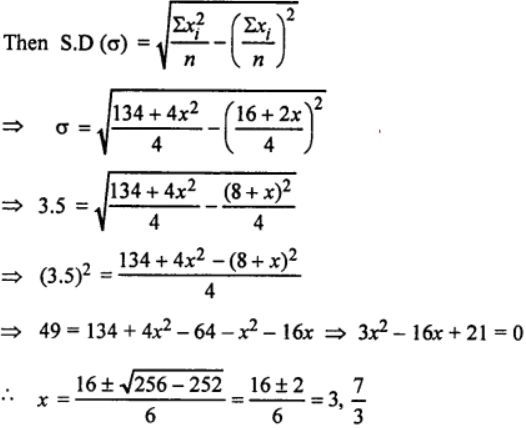
Que-4: Calculate the possible values of x, if the standard deviation of the numbers 2, 3, 2x and 11 is 3.5.
Sol:
Que-5: Calculate the standard deviation for the following distribution :
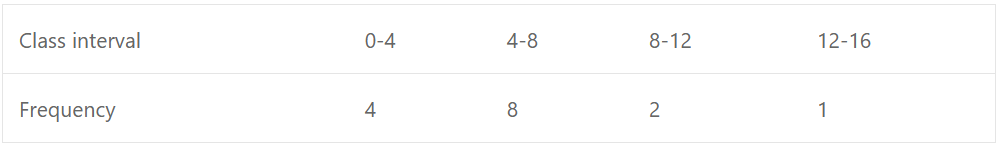
Sol: The table of values is given as under:
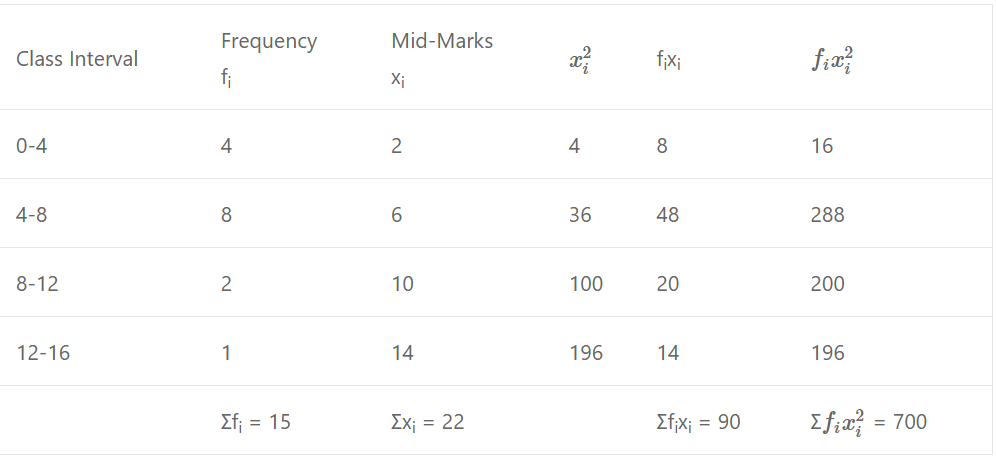
Then by direct method, we have
![]()
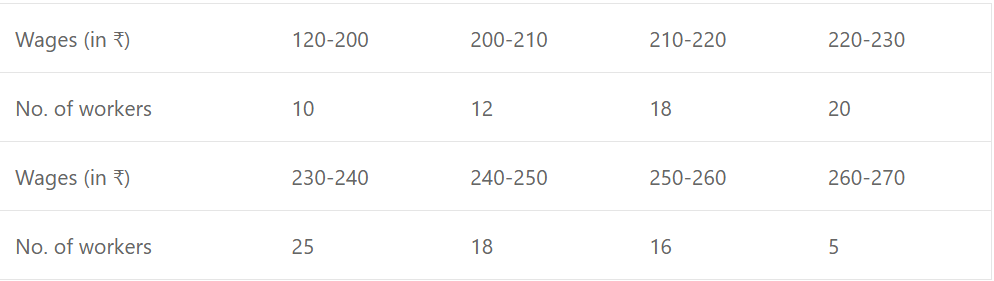
Que-6: Calculate the standard deviation of the following data :
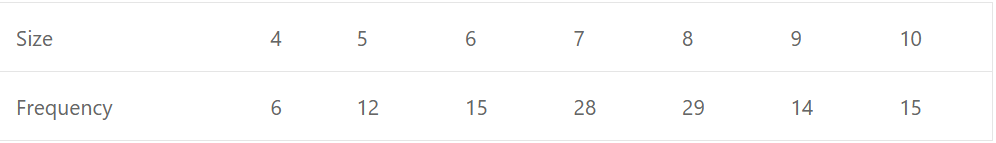
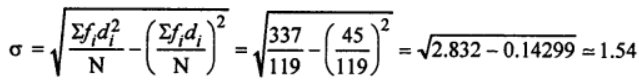
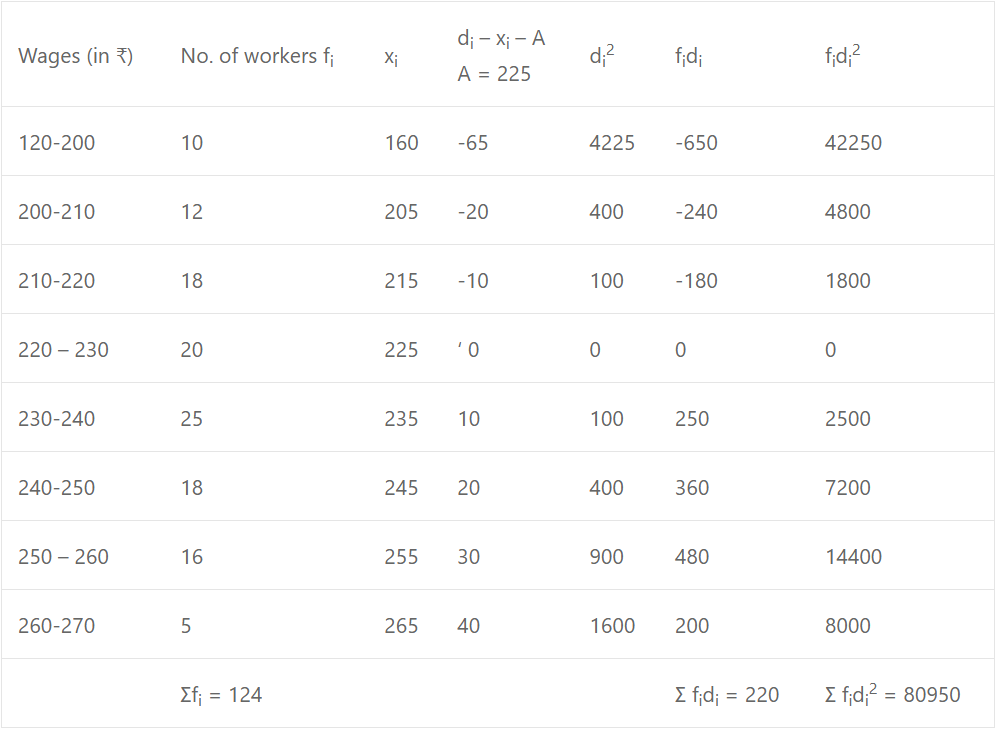
Sol:
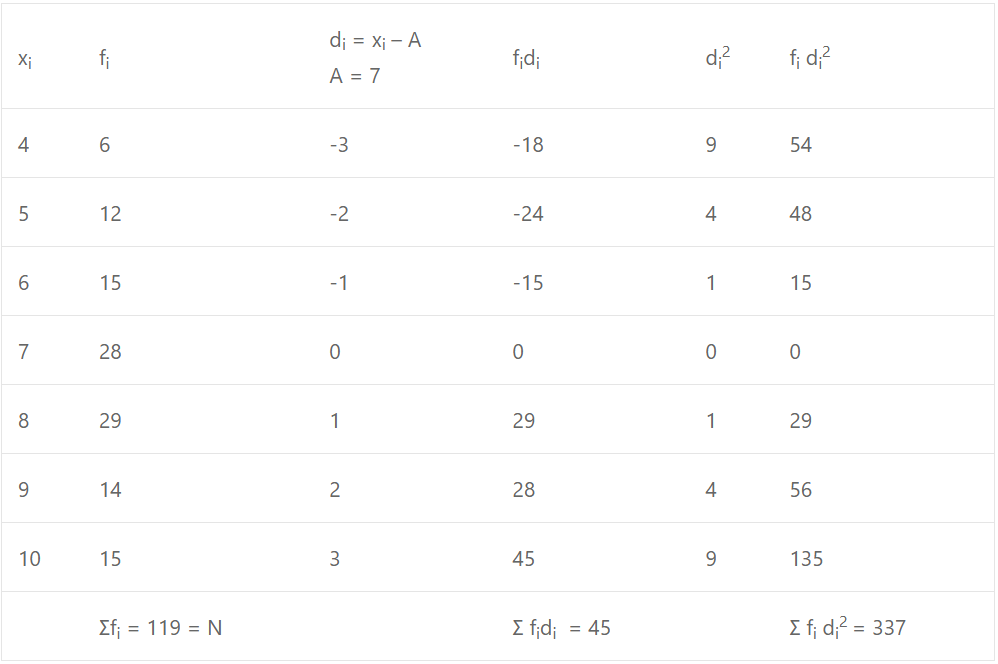
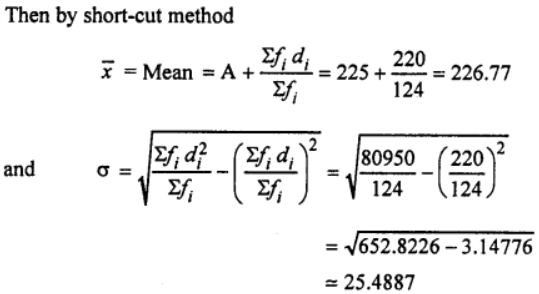
Then by short cut method, we have
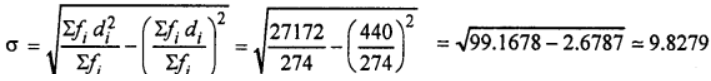
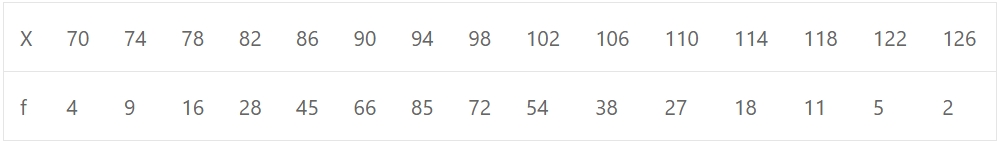
Que-7: Calculate the standard deviation of the following data:
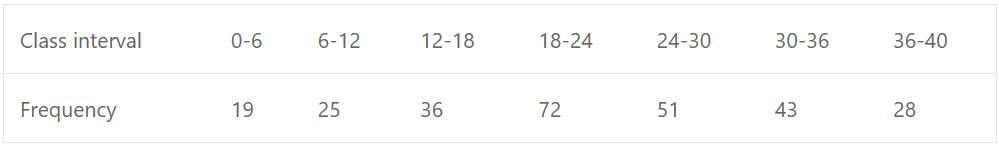
Sol:
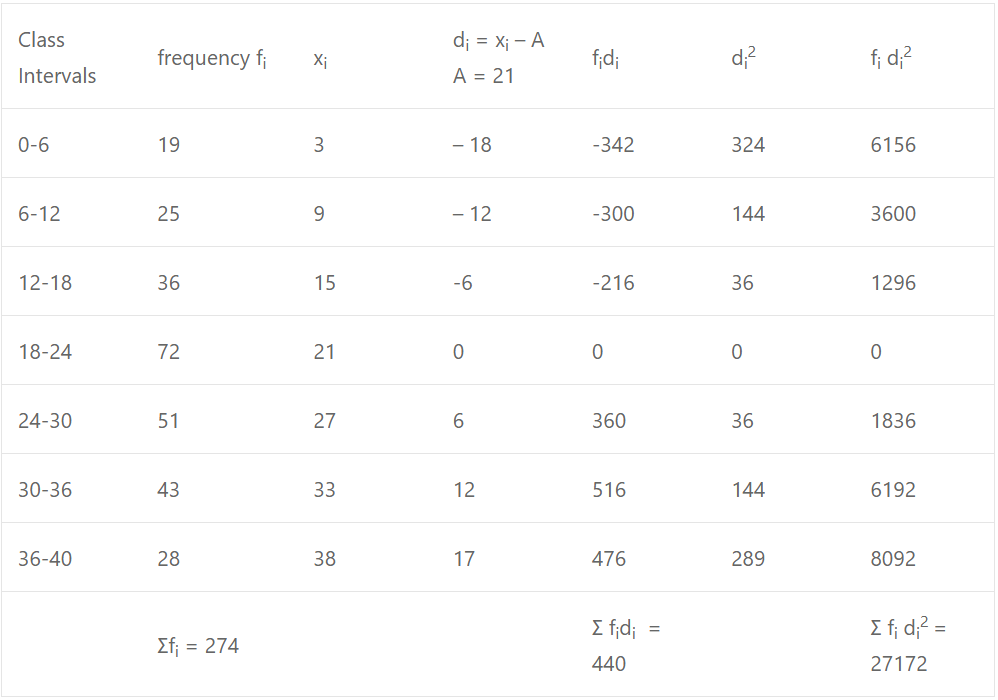
By short cut method, we have
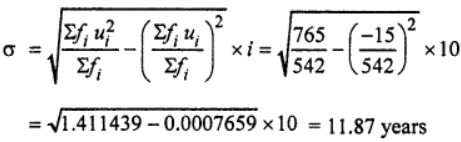
Que-8: Calculate the standard deviation for the following data giving the age distribution of persons.
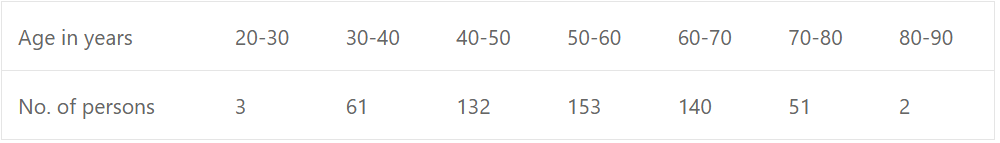
Sol: Same age be continuous variable
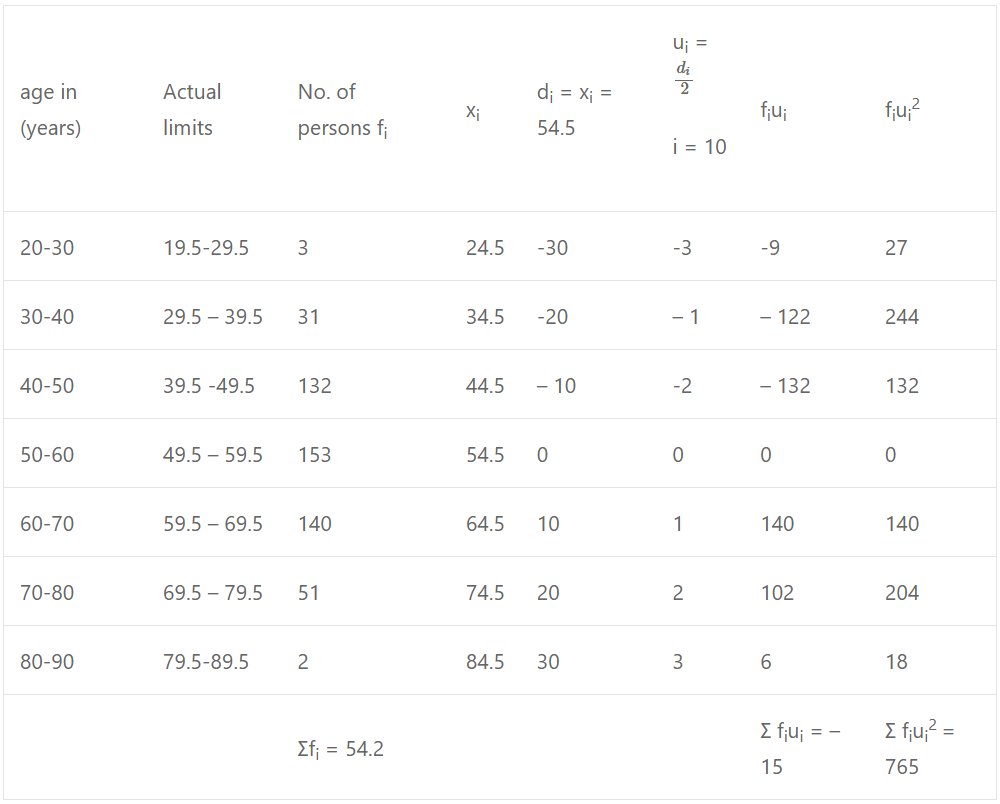
Then by step deviation method, we have
Que-9: The heights, to the nearest cm, of 30 men are given below :
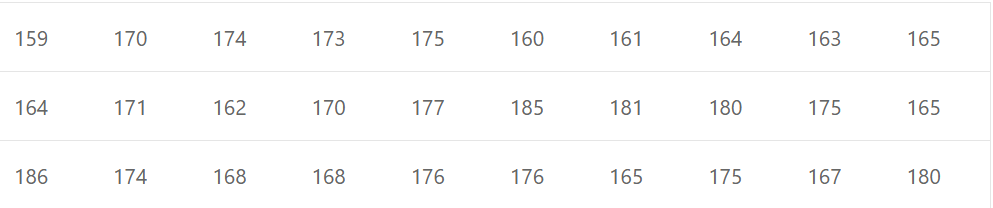
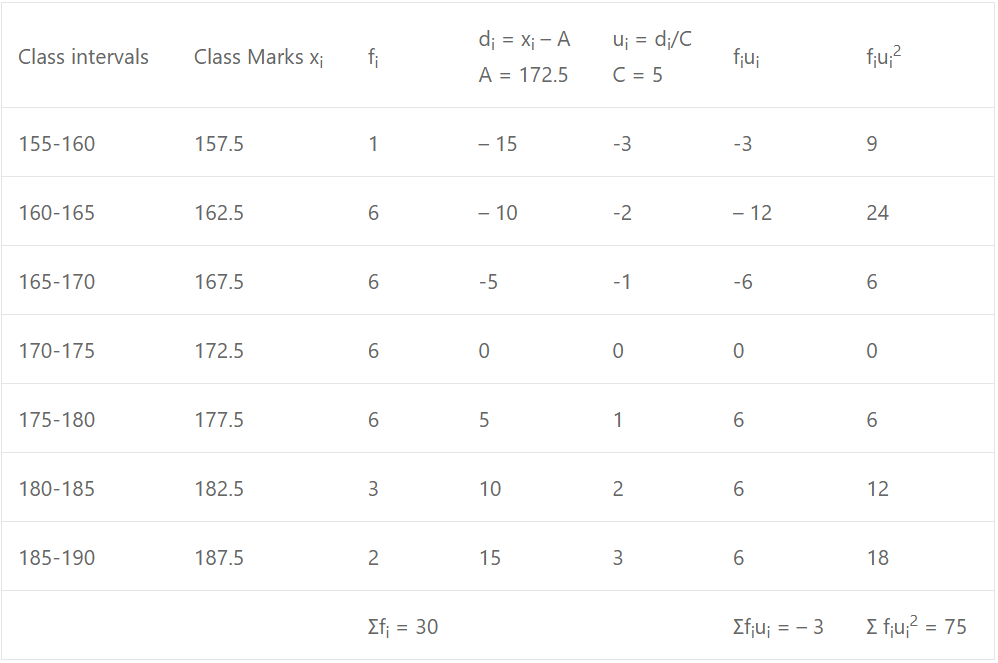
Using class intervals 155-160, 160-165,… draw up a grouped frequency distribution and use this to estimate the Arithmetic mean and standard deviation.
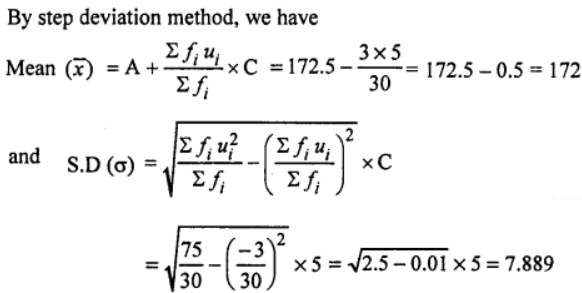
Sol: Table of values for given data is given as under :
Que-10: Find the mean and the standard deviation from the following :
Sol:
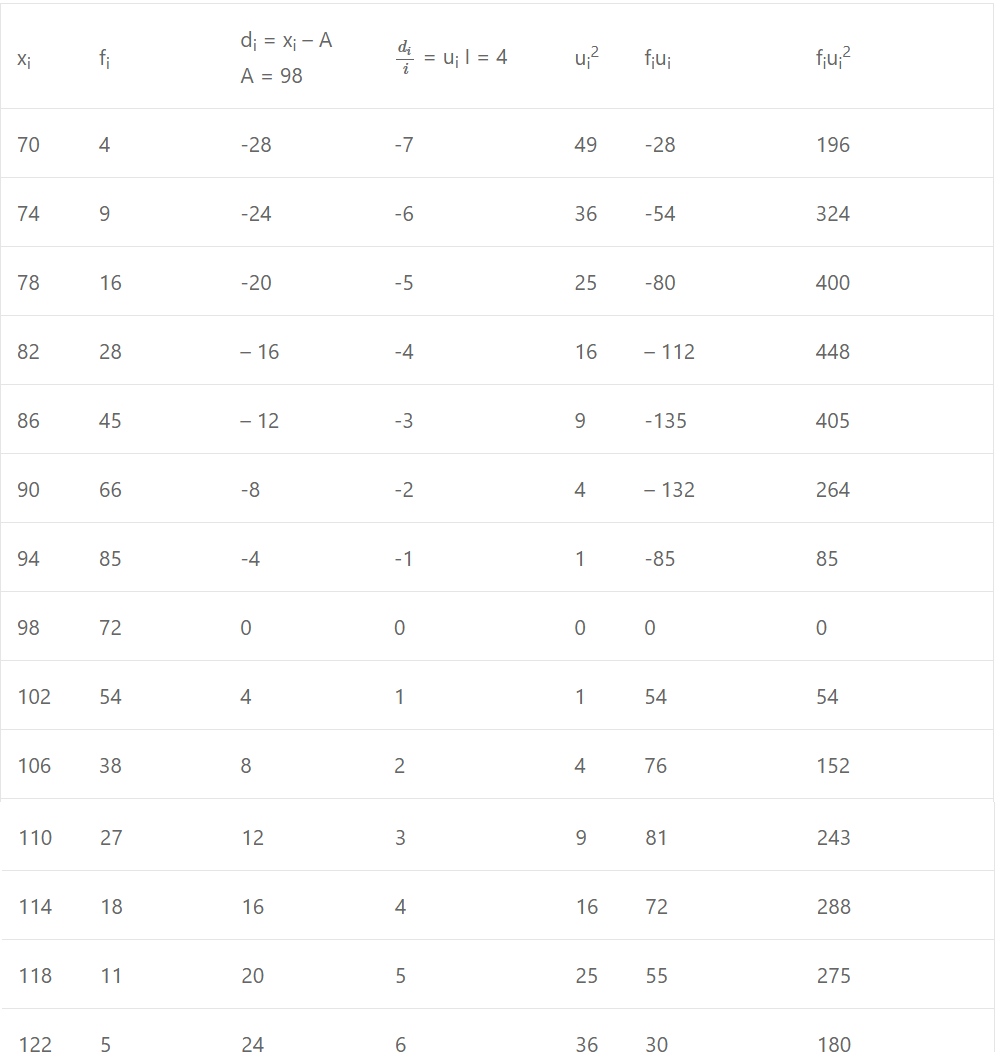
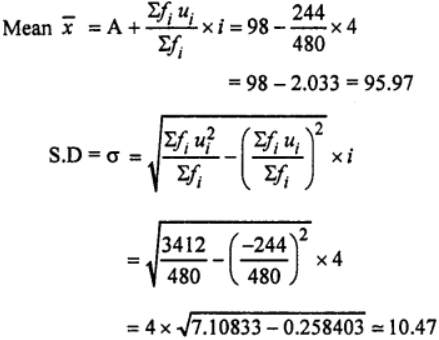
Que-11: The following table shows the I.Q. of 480 school children. Find
(i) the mean.
(ii) the standard deviation using the step deviation method. Use Chrlier’s check to verify the computation of the standard deviation.
Sol: The table of values is given as under :
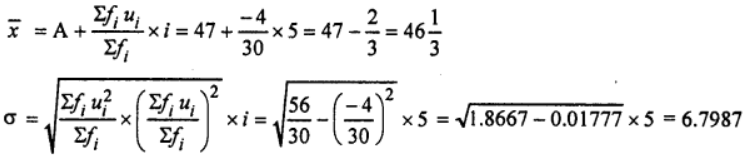
Que-12: In a certain test, the 30 scores were grouped as follows :
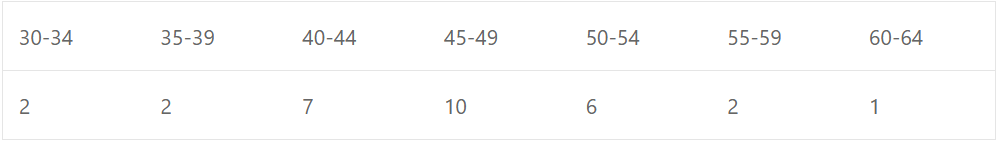
Calculate the mean and the standard deviation:
Sol: The table of values is given as under:
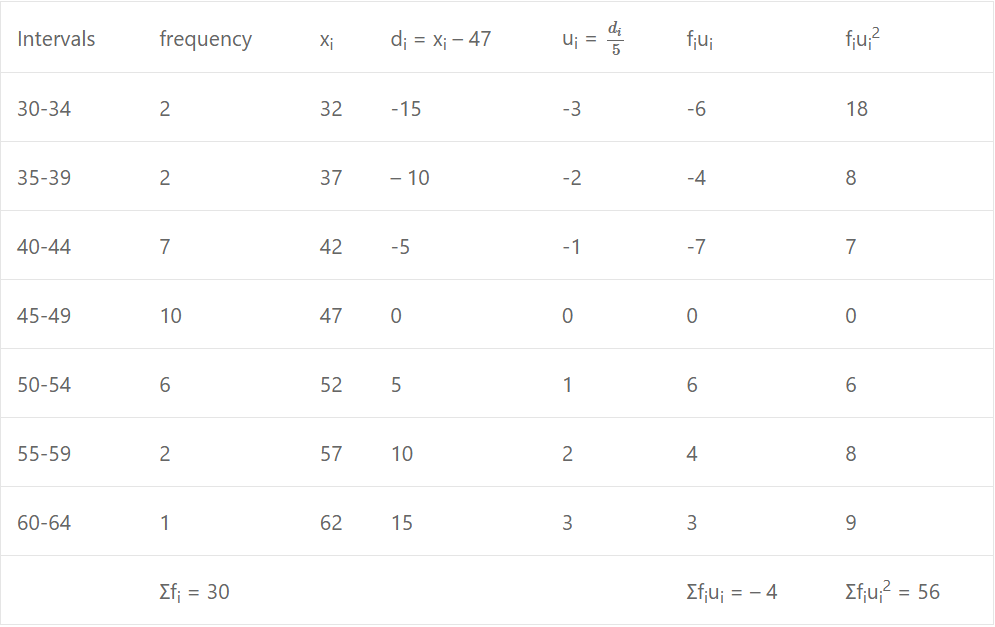
Then by step deviation method, we have
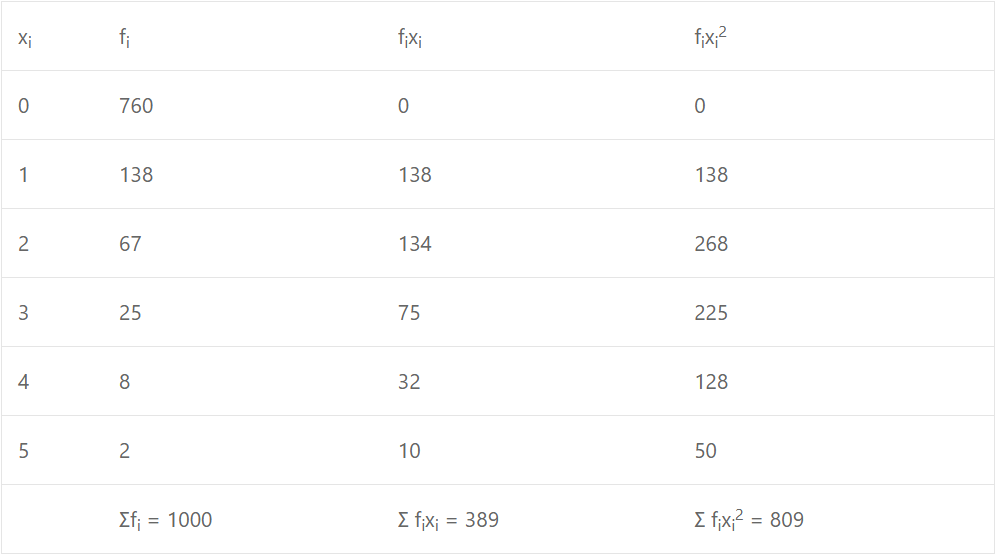
Que-13: The number of faults on the surface of each of 1000 tiles were distributed as follows :
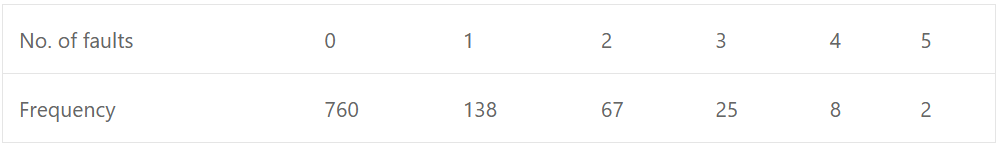
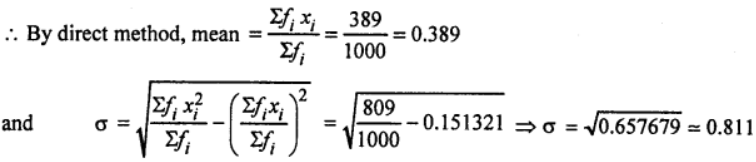
Calculate the mean and the standard deviation.
Sol: The table of values is given as under :
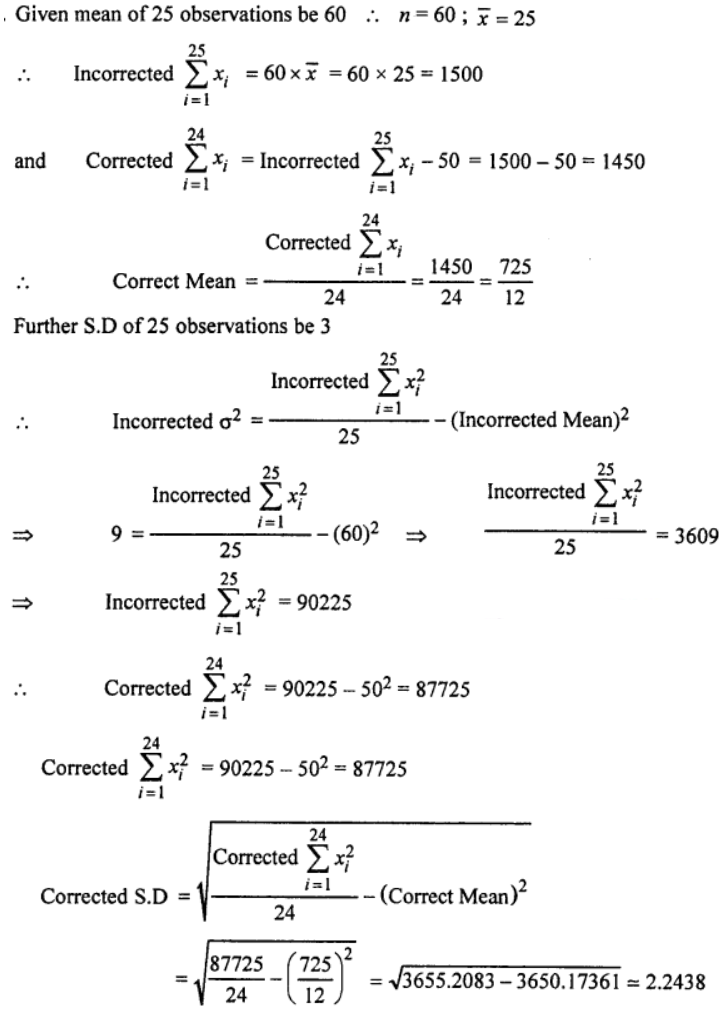
Que-14: The mean and the standard deviation of 25 observations and 60 and 3. Later on it was decided to omit an observation which was incorrectly recorded as 50. Calculate the mean and the standard deviation of the remaining 24 observations.
Sol:
Que-15: The scores of two golfers for 10 rounds each are:
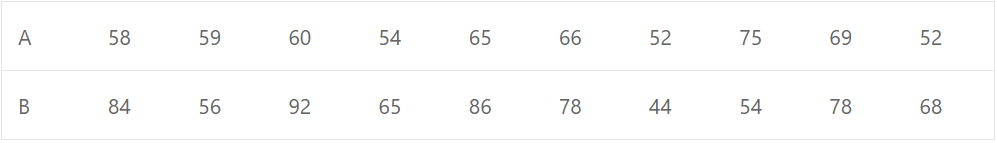
Which may be regarded as the more consistent player ?
Sol: For golfer A ; no. of observations = 10
and Sum of all observations = 58 + 59 + 60 + 54 + 65 + 66 + 52 + 75 + 69 + 52 = 610
∴Mean x¯ = Sum of all observations / 10 = 610/10 = 61
For golfer B : Sum of all observations = 84 + 56 + 92 + 65 + 86 + 78 + 44 + 54 + 78 + 68 = 705
∴Mean Y¯ = Sum of all observations / 10 = 705/10 = 70.5
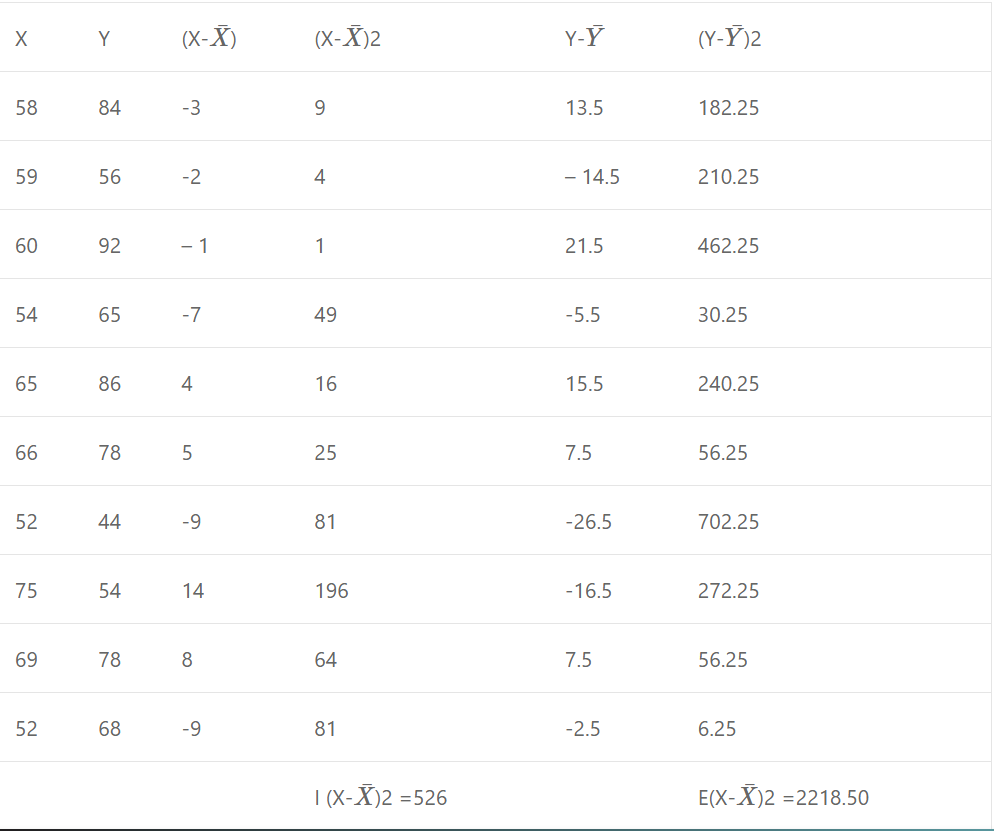
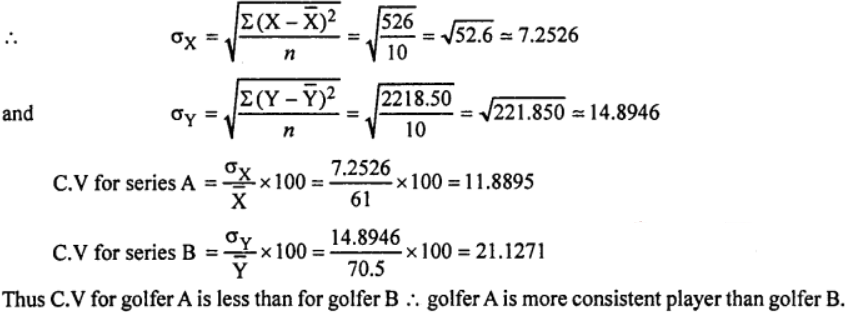
We construct the table of values is given as under :
Que-16: Goals scored by two teams A and B in a football season were as follows :
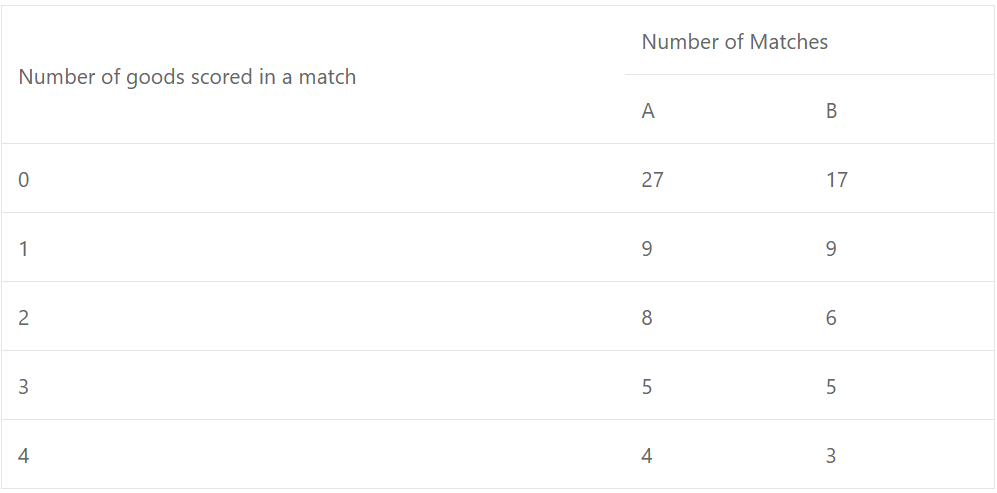
By calculating the coefficient of variation in each case find which team may be considered more consistent.
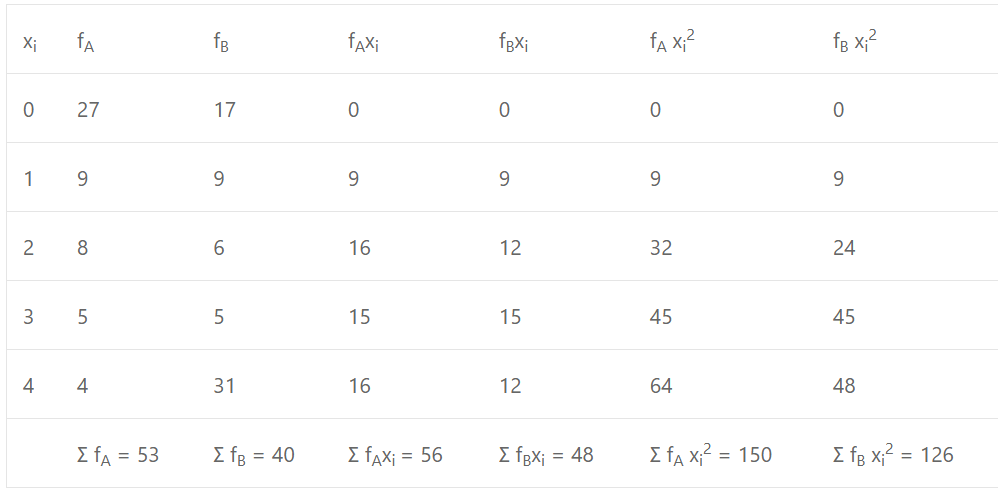
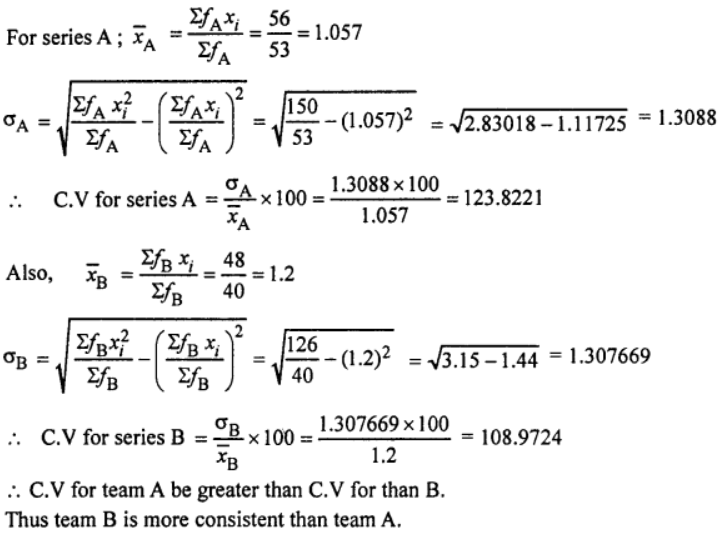
Sol: The table of values is given as under :
Que-17: The mean of the numbers a, b, 8, 5, 10 is 6 and the variance is 6.80. Then which one of the following gives possible values of a and b ?
(a) a = 0, b = 7
(b) a = 5, b = 2
(c) a = l, b = 6
(d) a = 3, b = 4
Sol: Given observations are a, b, 8, 5 and 10 ∴ no. of observations = n = 5, x¯ = 6, σ² = 6.80
∴ Mean = Sum of all given observations / n
⇒ 6 = (a+b+8+5+10)/5
⇒ 30 = a + b + 23
⇒ a + b = 7
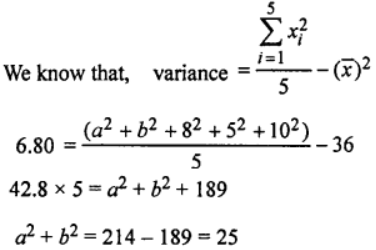
From (1) and (2); we have
a2 + (7 – a)2 = 25
⇒ 2a2 – 10a + 24 = 0
⇒ a2 – 7a + 12 = 0
⇒ (a – 3)(a – 4) = 0
⇒ a = 3, 4
When a = 3 ∴ from (1); b = 4
When a = 4 ∴ from (1); b = 3
∴ Ans. (d)
–: End of Measures of Dispersion Class 11 OP Malhotra Exe-21B ISC Maths Ch-21 Solutions. :–
Return to :- OP Malhotra ISC Class-11 S Chand Publication Maths Solutions
Please share with your friends
Thanks


