Moving Average Class 11 OP Malhotra Exe-31A ISC Maths Ch-31 Solutions. In this article you would learn about Calculating the Moving Averages and its Graph. Step by step solutions of latest textbook has been given as latest syllabus. Visit official Website CISCE for detail information about ISC Board Class-11 Mathematics.
Moving Average Class 11 OP Malhotra Exe-31A ISC Maths Solutions Ch-31
| Board | ISC |
| Publications | S Chand |
| Subject | Maths |
| Class | 11th |
| Chapter-31 | Moving Average |
| Writer | O.P. Malhotra |
| Exe-31(A) | Calculating the Moving Averages and its Graph. |
Calculating the Moving Averages and its Graph.
Moving Average Class 11 OP Malhotra Exe-31A ISC Maths Ch-31 Solutions.
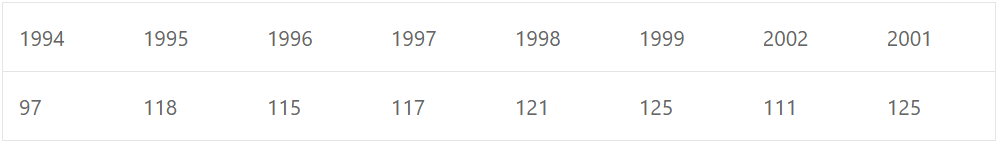
Que-1: The table shows the number of students in a school getting at least a grade C in mathematics for the years 1994 to 2001.
(i) Represent this data as a time series.
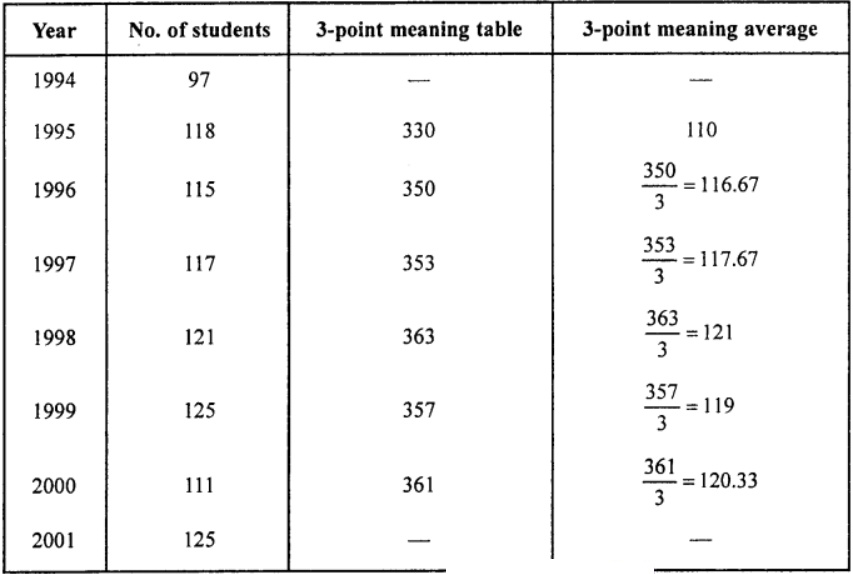
(ii) Calculate the 3-point moving average and plot it on the same graph.
(iii) Are the school’s maths results improving?
(iv) Explain why this is not a good way to work out whether the school’s results are improving.
Sol: (i) The table of values is given as under :
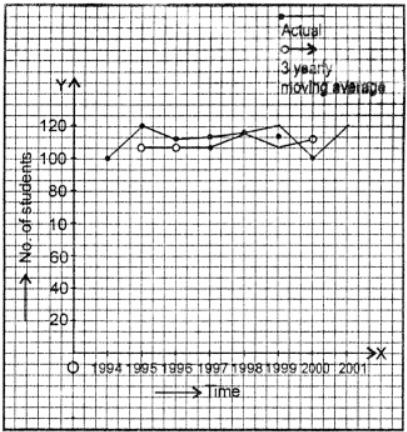
(iii) The set of data is smoothed out and is increasing.
(iv) The number is increasing but might be because the school is getting bigger.
Que-2: The profits of a soft drink firm in thousands of litres during each month of a year were :
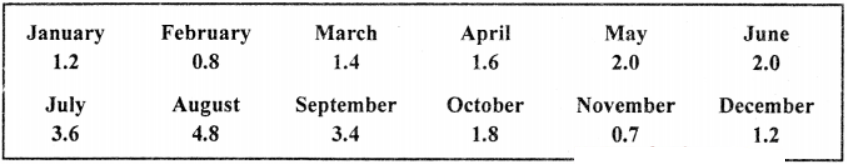
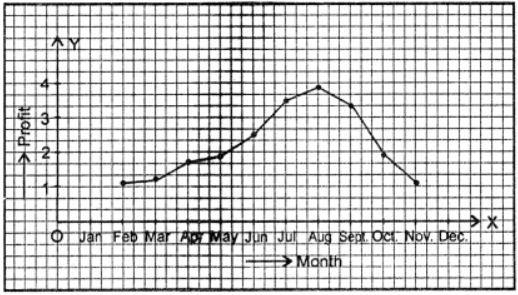
Calculate 3-monthly moving averages and illustrate graphically.
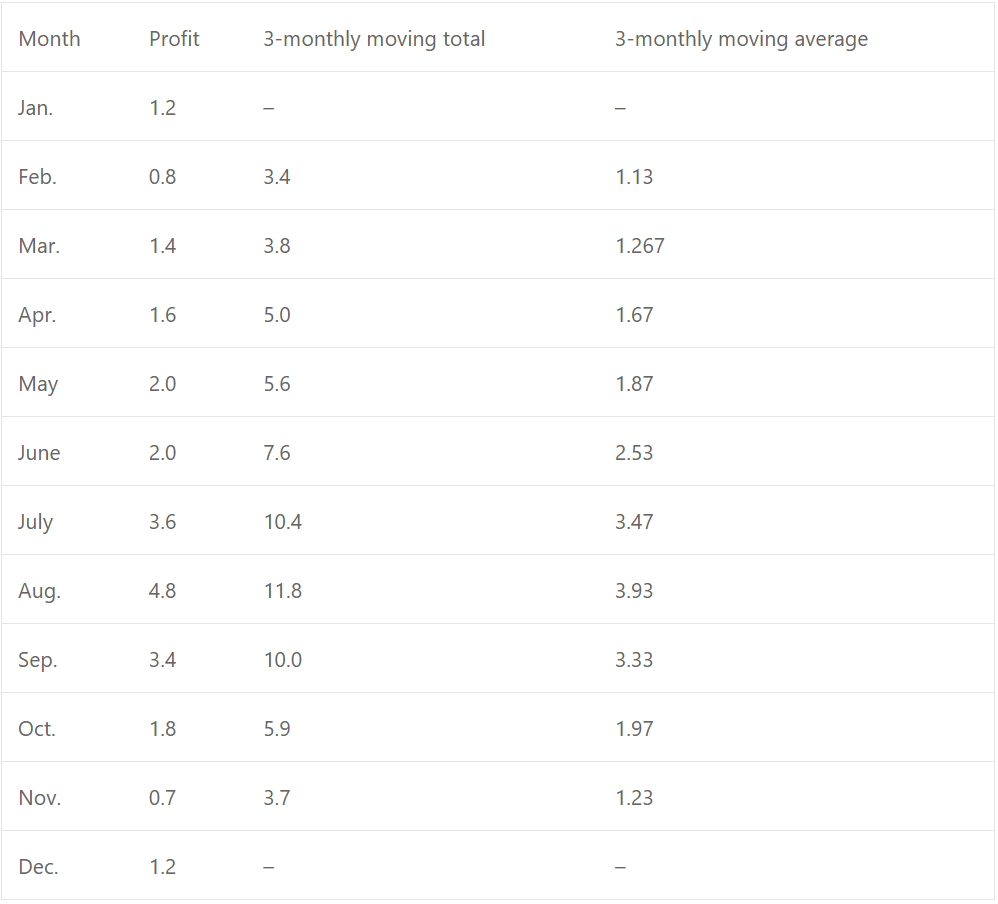
Sol: Calculation of 3-monthly moving arrange is given as :
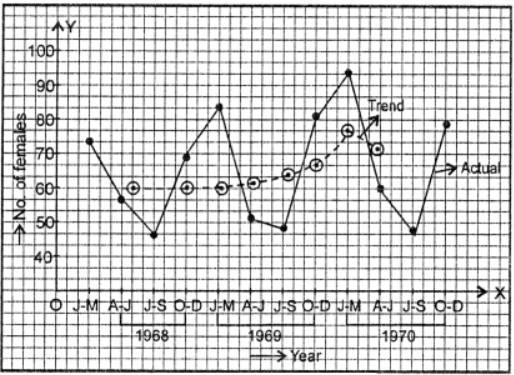
Que-3: The number of traffic offences committed in a certain city over a period of 3 years is given in the following table :
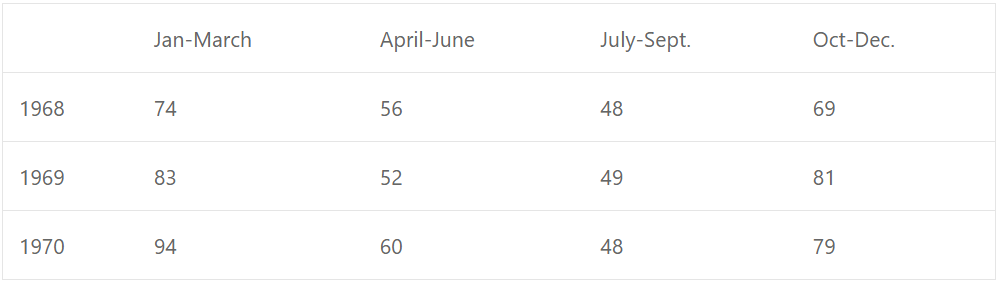 Calculate 4-quarterly moving averages and illustrate these and original figures on one graph using the same axis for both. Comment briefly on a local politician’s claim that traffic offences were on the increase.
Sol:
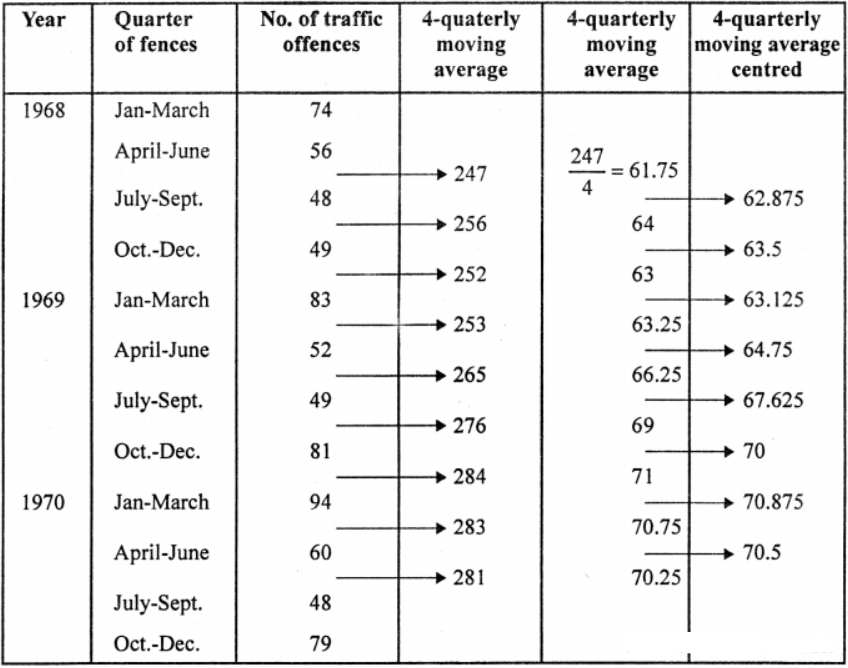
Thus the local politician’s claim that traffic offences were on the increase be true, it is cleared from 4-quarterly moving average centred column.
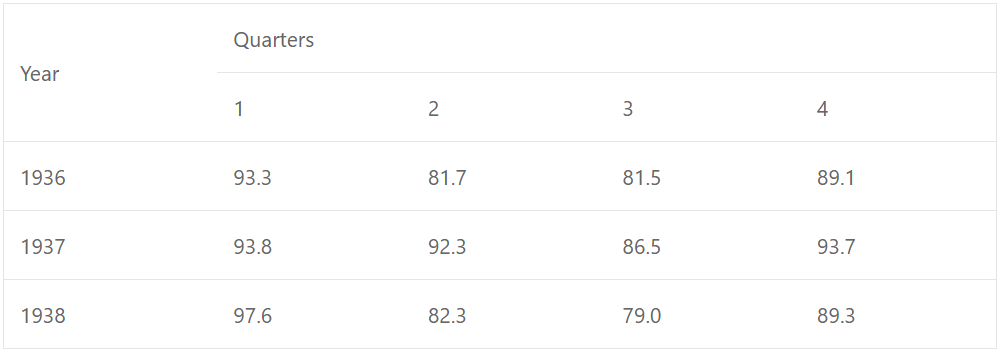
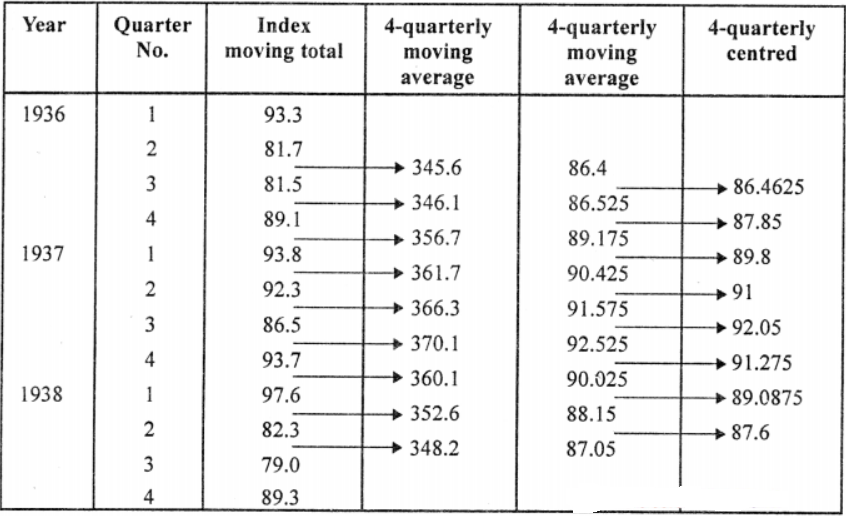
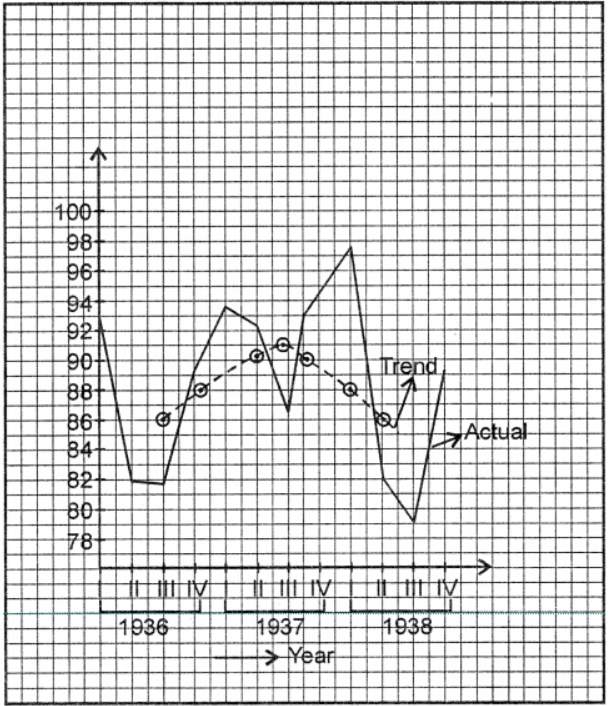
Que-4: Find the 4-quarterly moving averages in the following table which gives the quarterly index numbers of coal production (for the years 1936-1938). Also plot on the same graph the quarterly index numbers as well as the 4-quarterly moving average. Comment on the nature of the general trend.
Sol:
Que-5: The annual incomes of a firm were recorded every quarter for 4 years. The results are shown in this table.
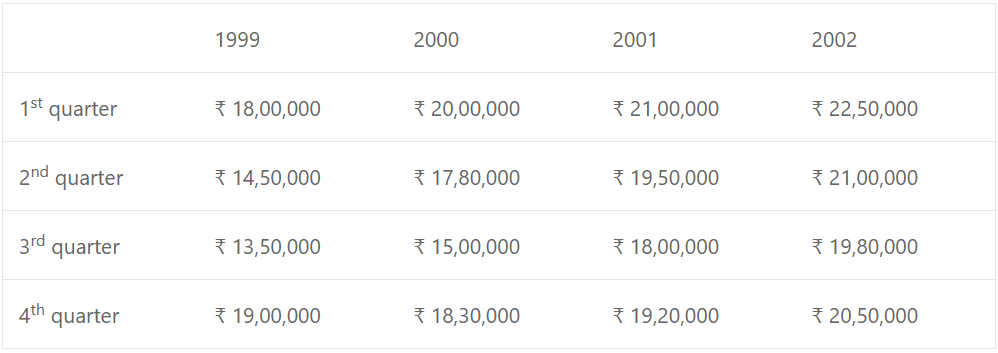
(i) Work out the 4-point moving average for the data.
(ii) Plot the original data and the moving average on the same graph.
(iii) Comment on how the firm’s incomes have changed over the 4-years.
Sol:
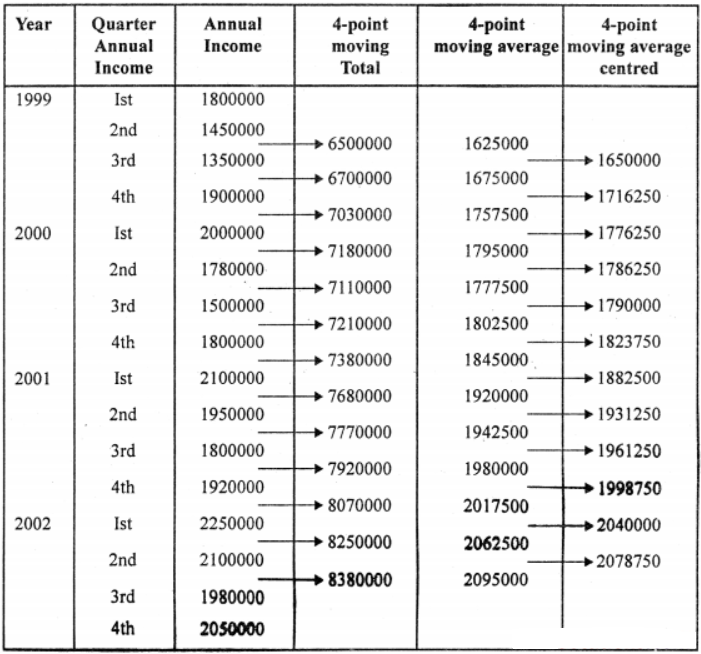
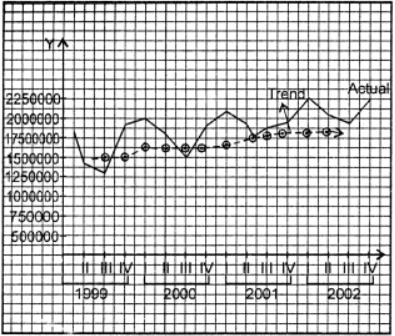
The data has been smoothed out so there is a steady increase in Income.
Que-6: The following table shows the daily sales of milk at a local corner shop for a month.
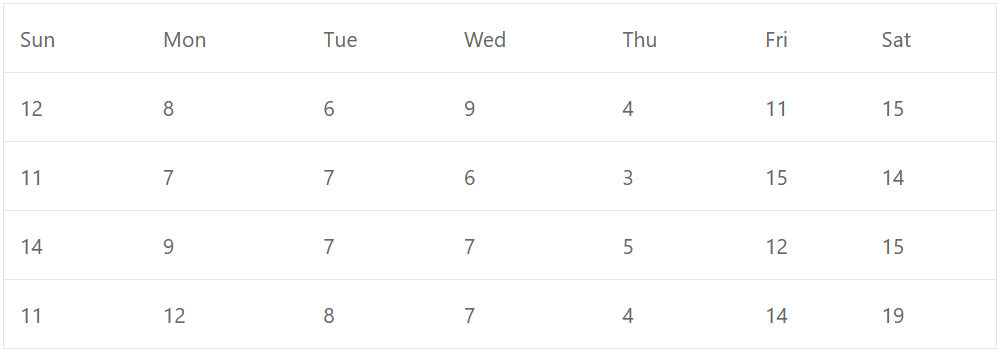
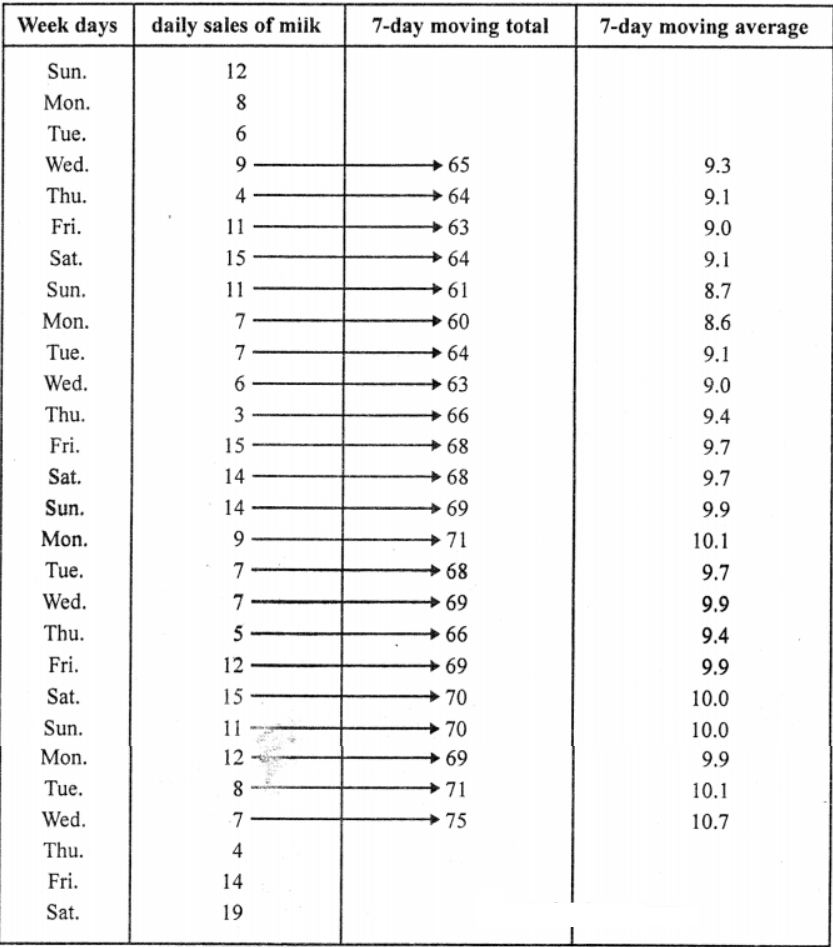
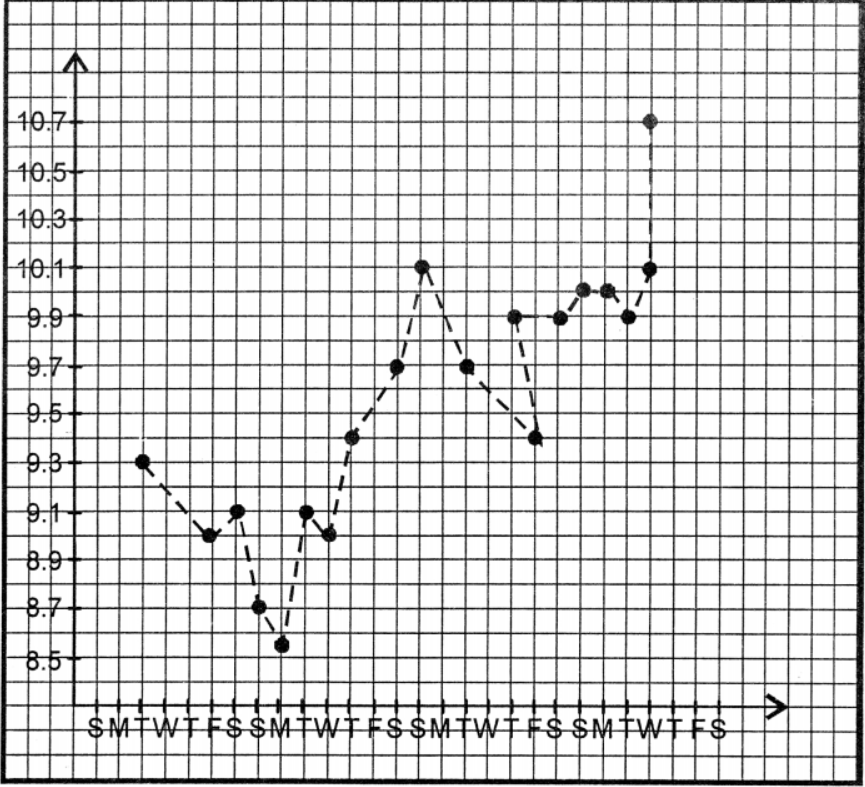
Make a table showing the moving average using a 7-day span, and draw a graph to show the trend of milk sales over the month.
Sol:
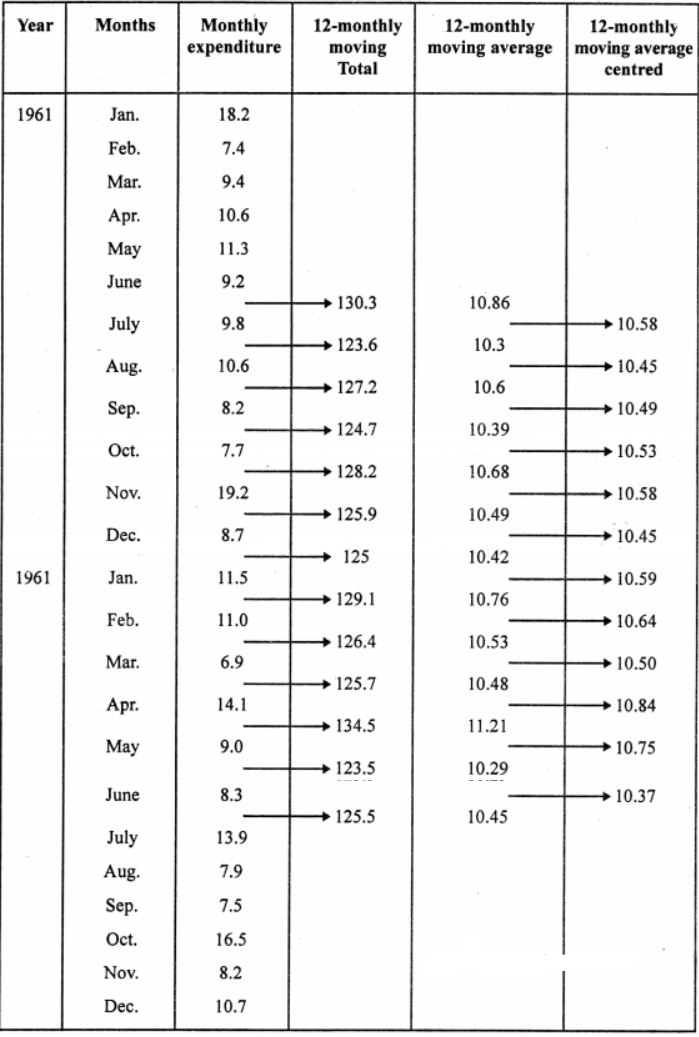
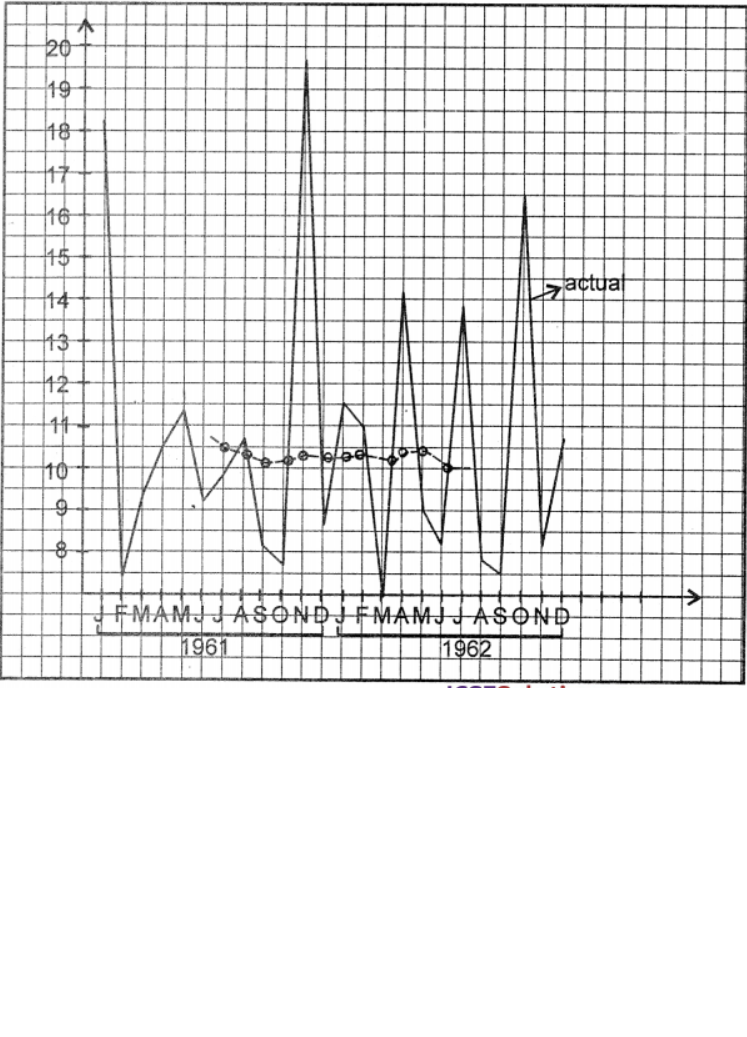
Que-7: The following table gives the monthly expenditure on a motor car for a period of two years.
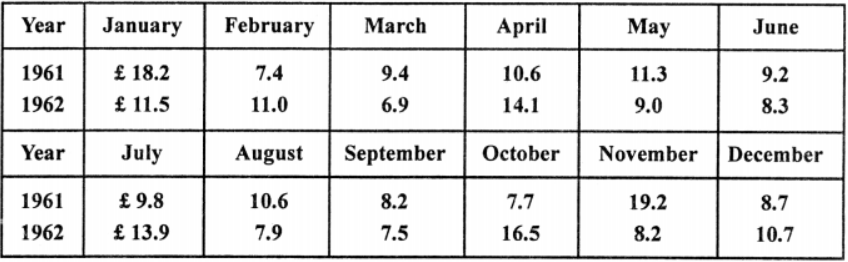
Calculate 12-month!y moving average for the two years and display them and the original table on the same graph.
Sol:
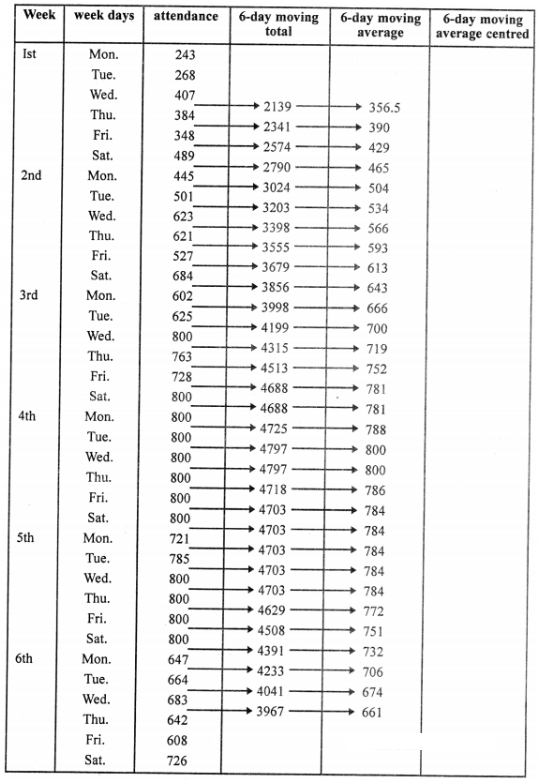
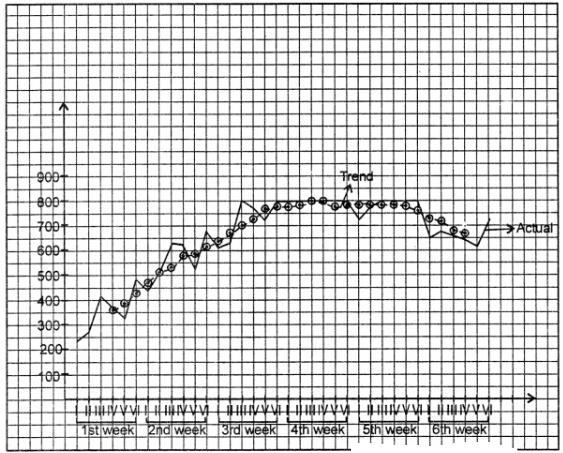
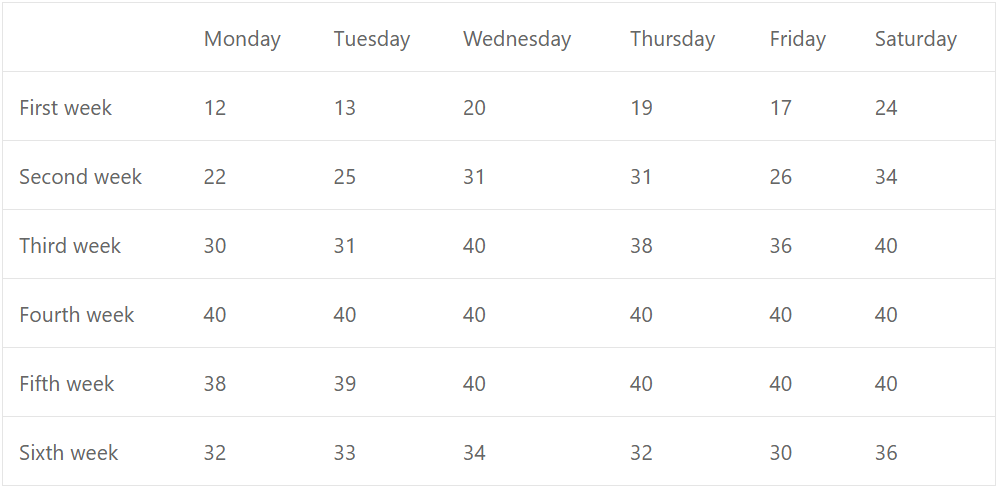
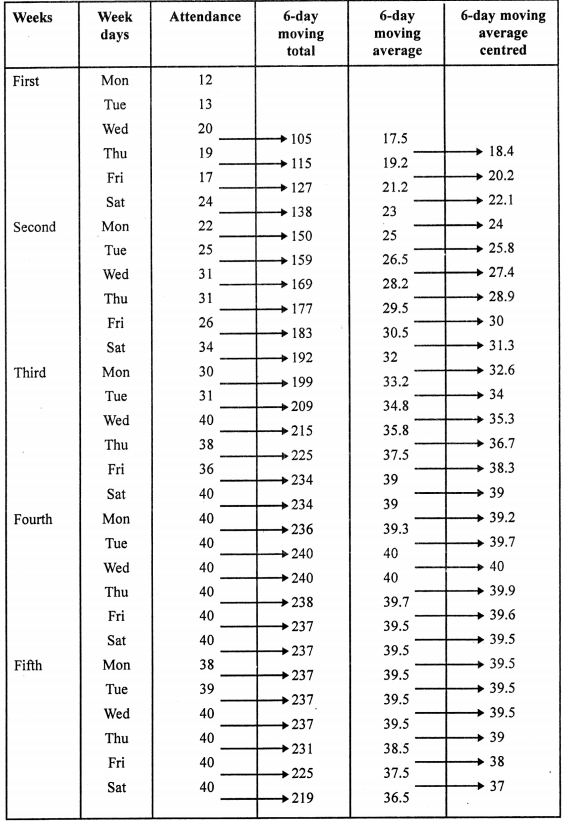
Que-8: A new film was shown at a theatre and ran for six weeks. The attendances are shown in the table.
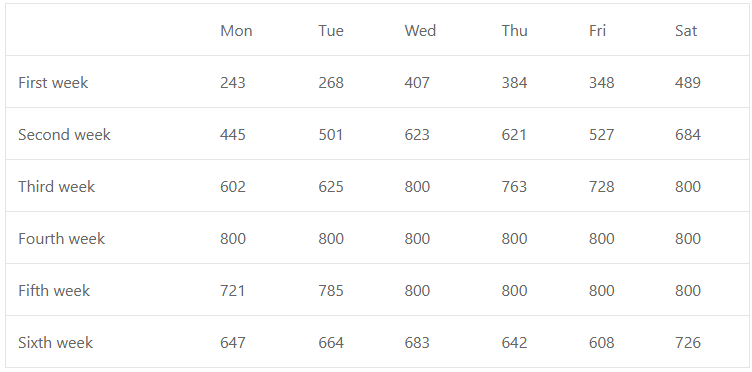
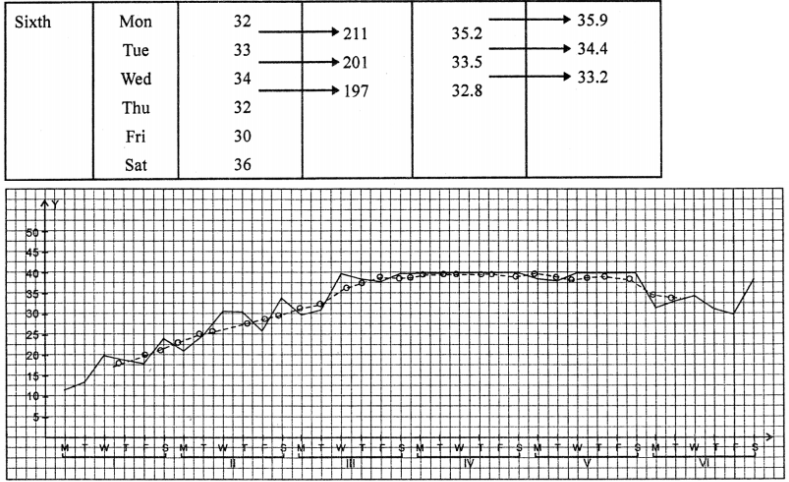
(i) Plot a line graph from the above data.
(ii) Calculate the 6-day moving average for the data and plot this on the same graph.
(iii) Comment on the weekly attendance.
Sol:
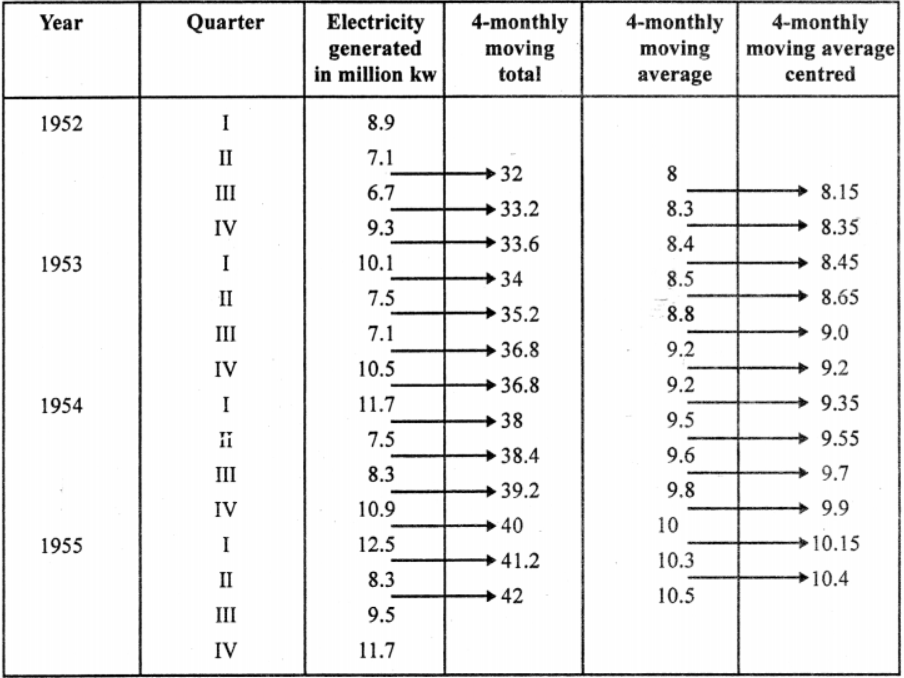
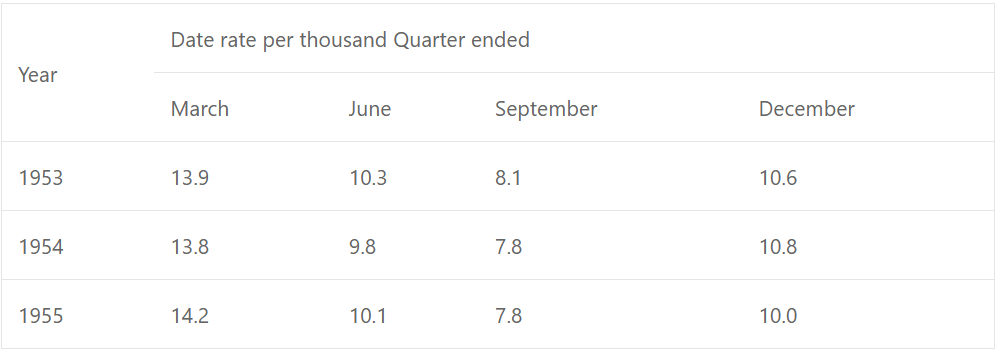
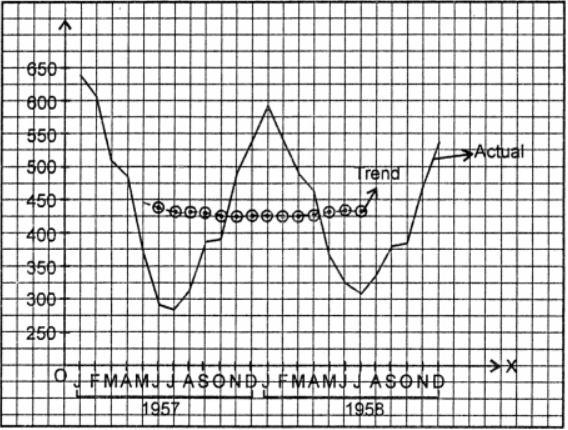
Que-9: The table below given details of the electricity generated in million kilowatt hours for public supply in each quarter of the years 1952 to 1955.
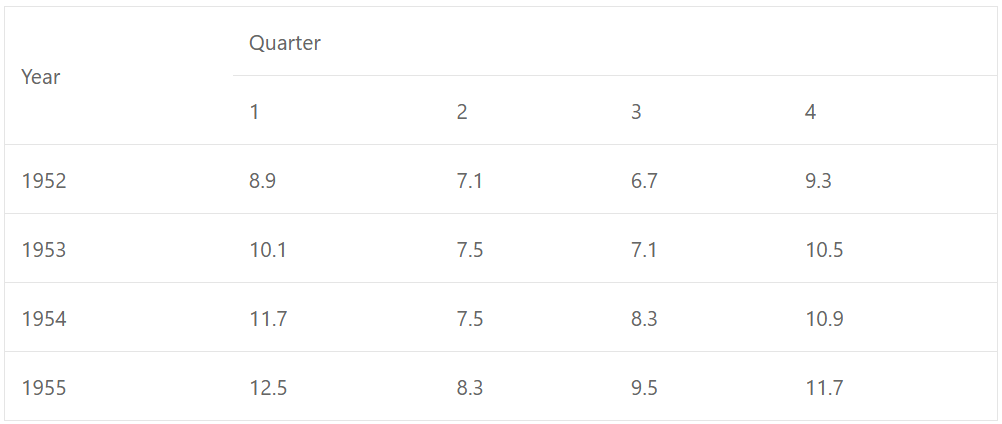
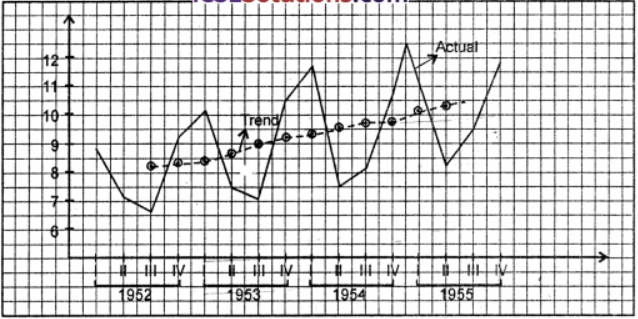
Draw a graph illustrating these figures.
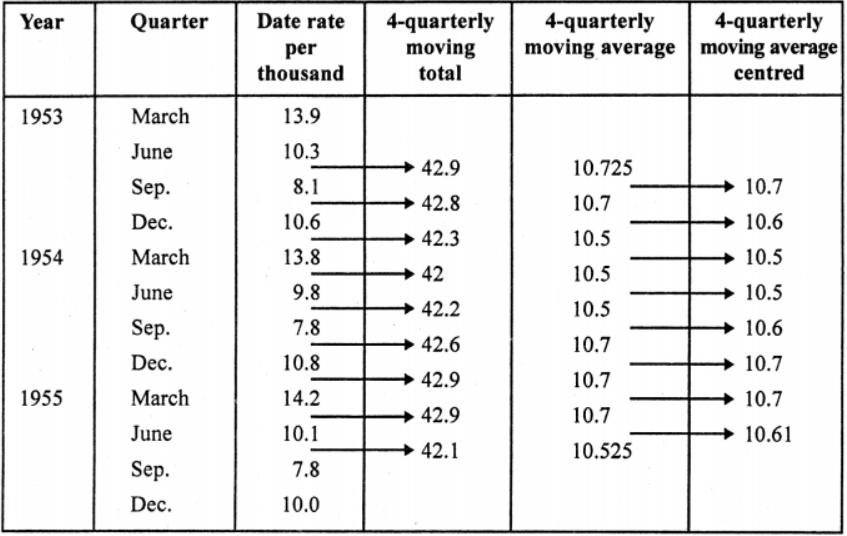
Calculating a set of moving averages using the most suitable number of observations; give reasons of your choice. On the same diagram as before draw a graph showing the moving averages
Sol: We shall use 4-monthly moving average as it null eliminate the 12 monthly cycle and leave the general trend of the data.
Que-10: The number of letters, in hundreds, posted in a certain city on each day of a fornight was as follows:
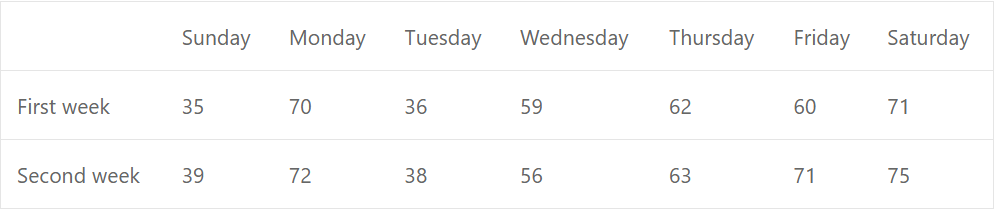
Calculate the 7-day moving averages and display these and the original figures graphically on the same diagram, using the same scale and axes. What is the general trend ?
Sol:
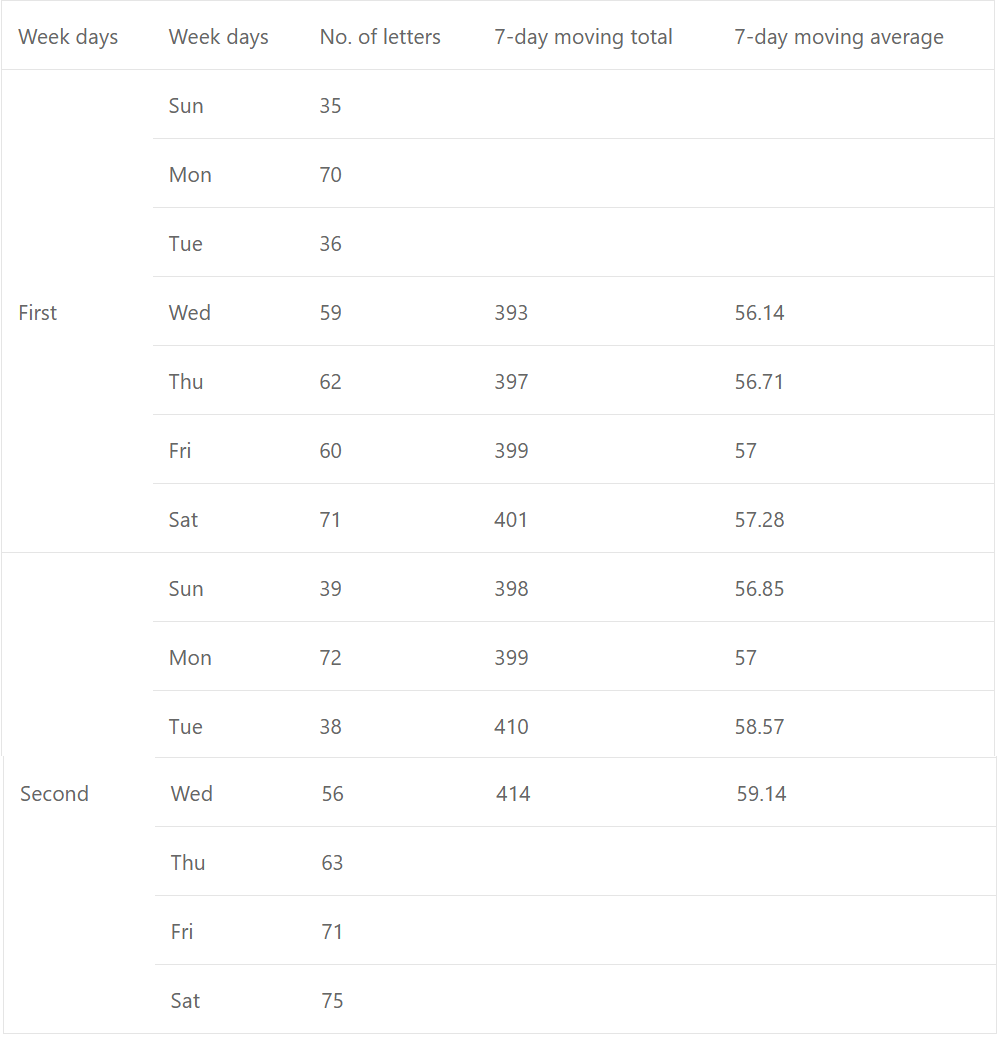
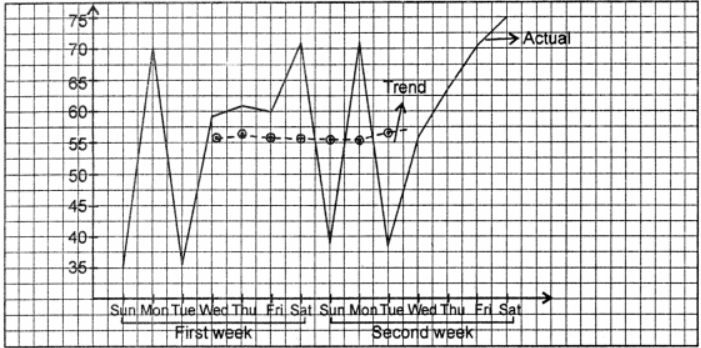
From graph and table, we observe that the general trend is that the no. of letters posted goes on increasing every day week after week.
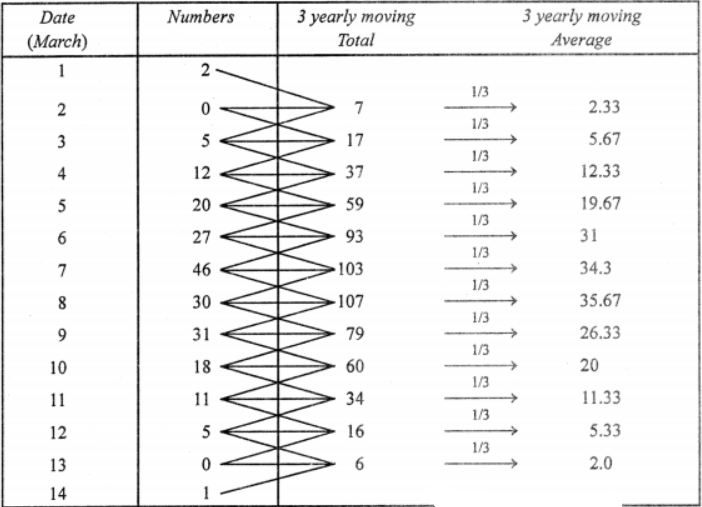
Que-11: In an influenza epidemic the numbers of cases diagnosed were :
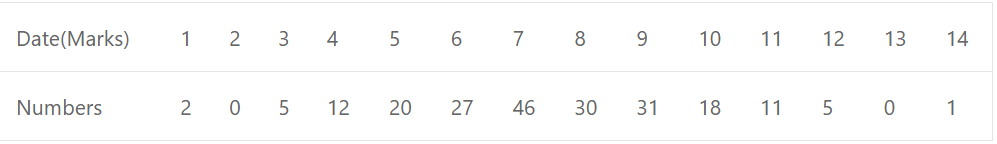
On what days do the mode and upper and lower quartiles occur ?
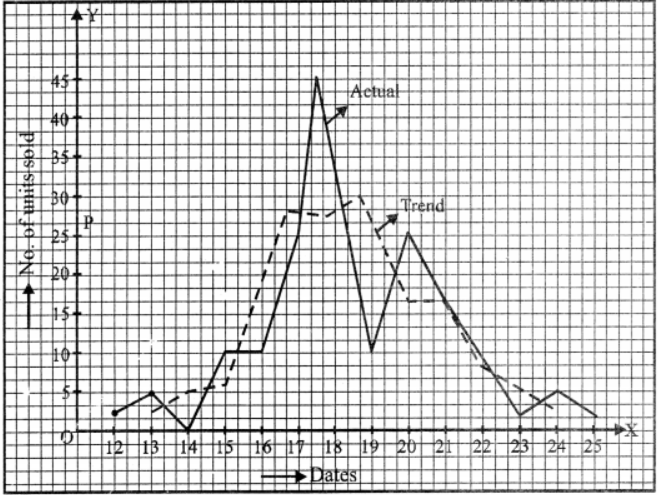
Calculate 3-day moving averages and display them and the original figures on the same graph.
Sol: Calculation of 3 yearly moving average
Que-12:
 Plot these figures on a graph.
Calculate the 4-quarterly moving averages and plot on the same graph.
Sol:
Que-12: Registered unemployed (hundreds)
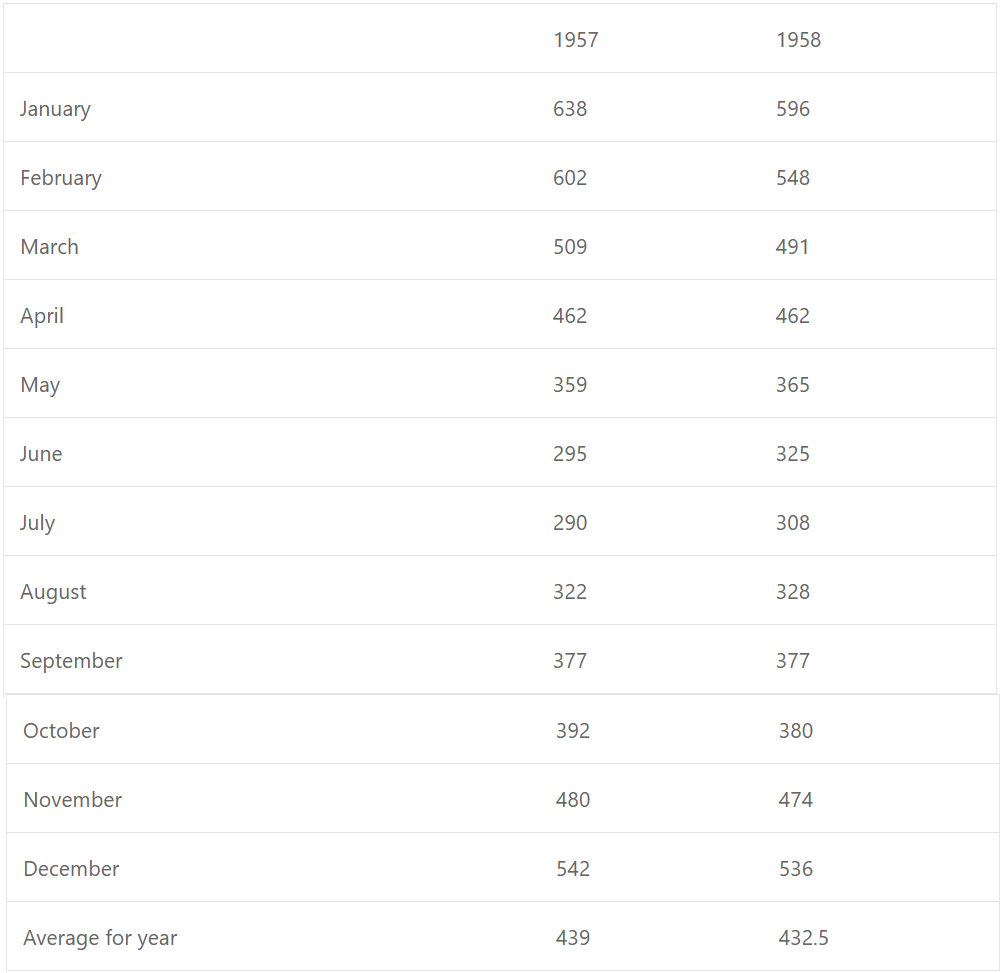
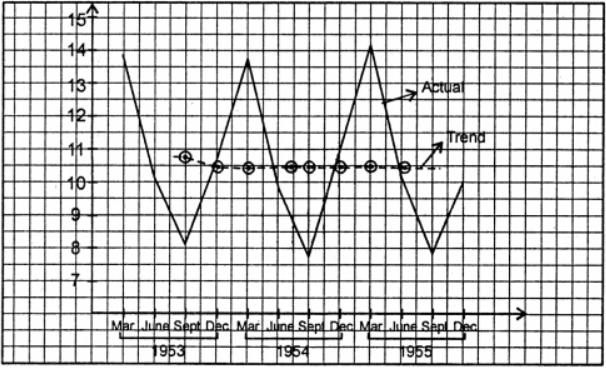
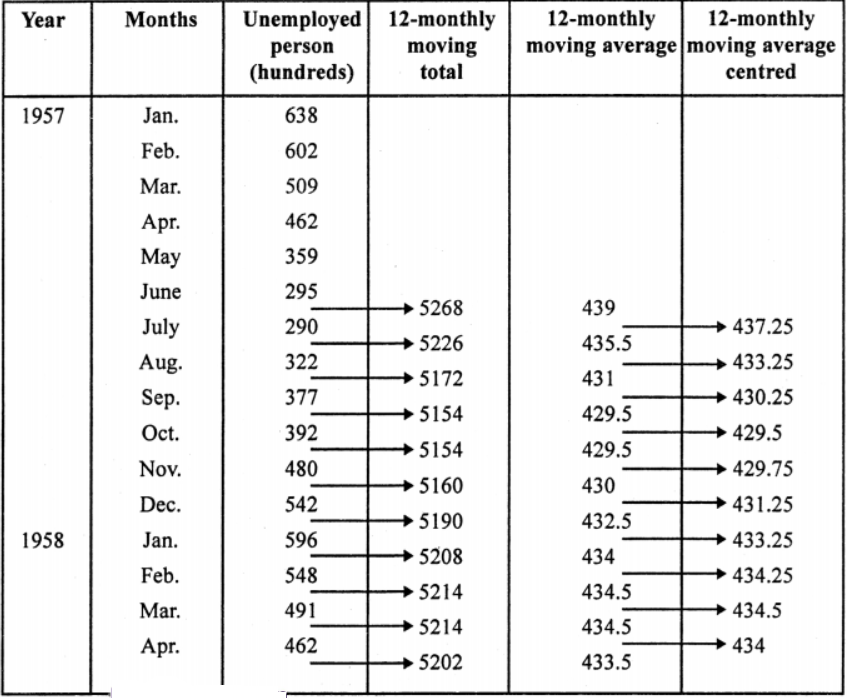
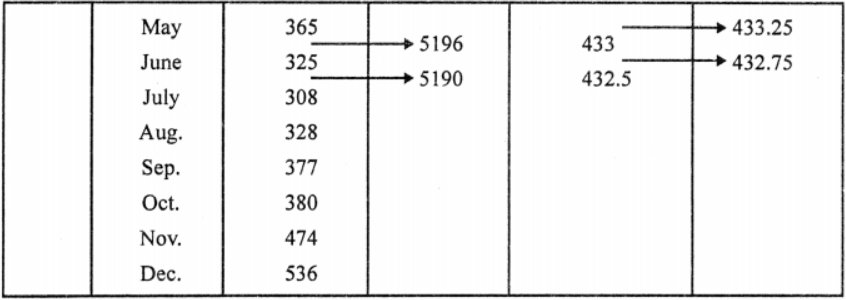
Plot these monthly figures on a graph. Calculate the 12-monthly moving averages and plot these on the same graph.
Sol:
Que-14: A Ballet Company gave a 6-weeks’ season at a large hall capable of seating 4000 people and the attendances in hundreds, at the evening performances, are recorded in the following table.
Attendance, in hundreds, to nearest hundred
 Plot a graph of the above time-series and include on the same diagram the graph of 6-day moving averages.
Comment on the weekly cycle on attendances and state, with reasons, if you think, an extension of the season of eight weeks, would have been justified.
Sol:
Que-15: Production of passenger cars, U.S.A. (tens of thousands)
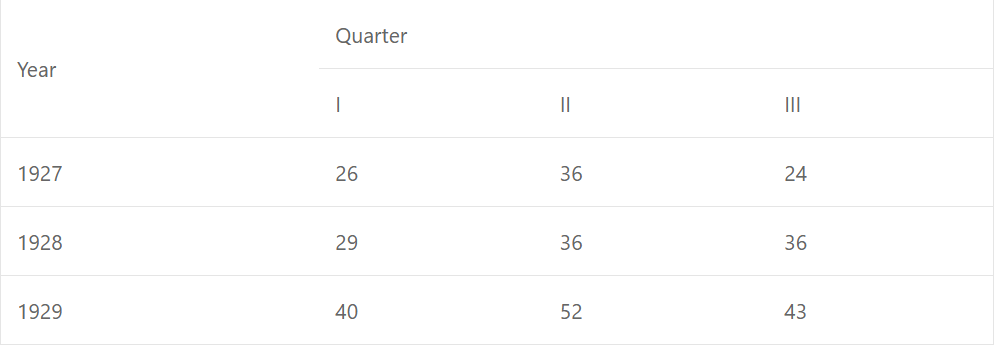
Calculate the 4-quarterly moving averages and then draw the graphs of the given series and the moving averages. Briefly comment on the general trend.
Sol:
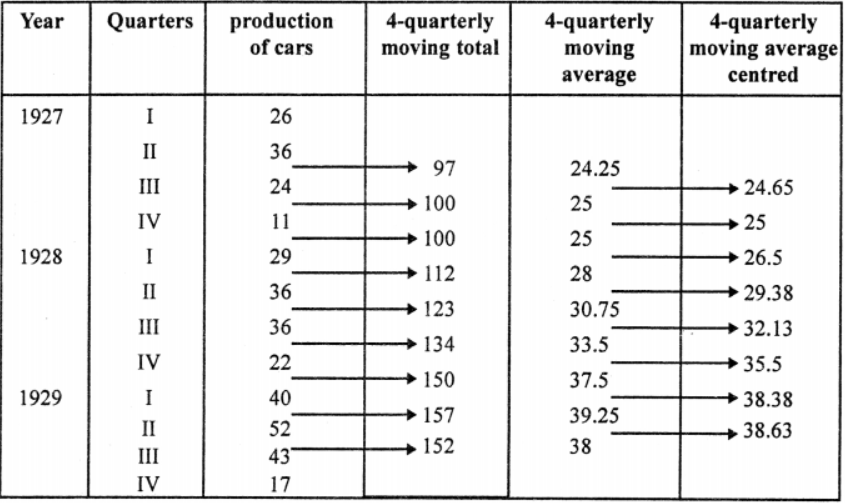
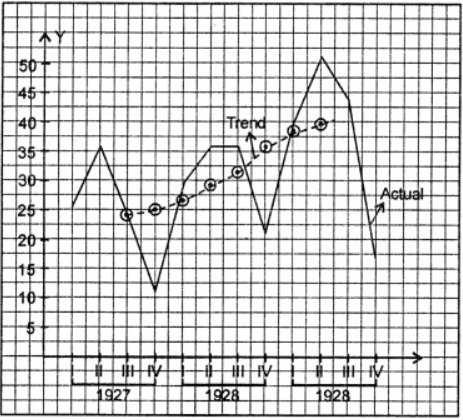
From table and graph it is observed that, the demand of cars was increasing year after year.
Que-16: The aggregate number, in millions, of working days lost in strikes during each year of the period 1950-60 was
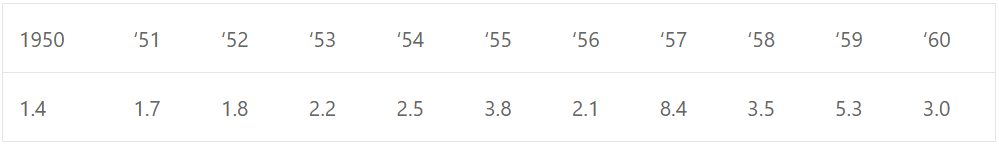
Draw a graph to represent this information. Calculate the 3-yearly moving averages and draw the 3-yearly moving averages graph, using the same axes and scales. What is the main purpose in drawing moving average graph ? Comment on whether the purpose is achieved in this case.
Sol:
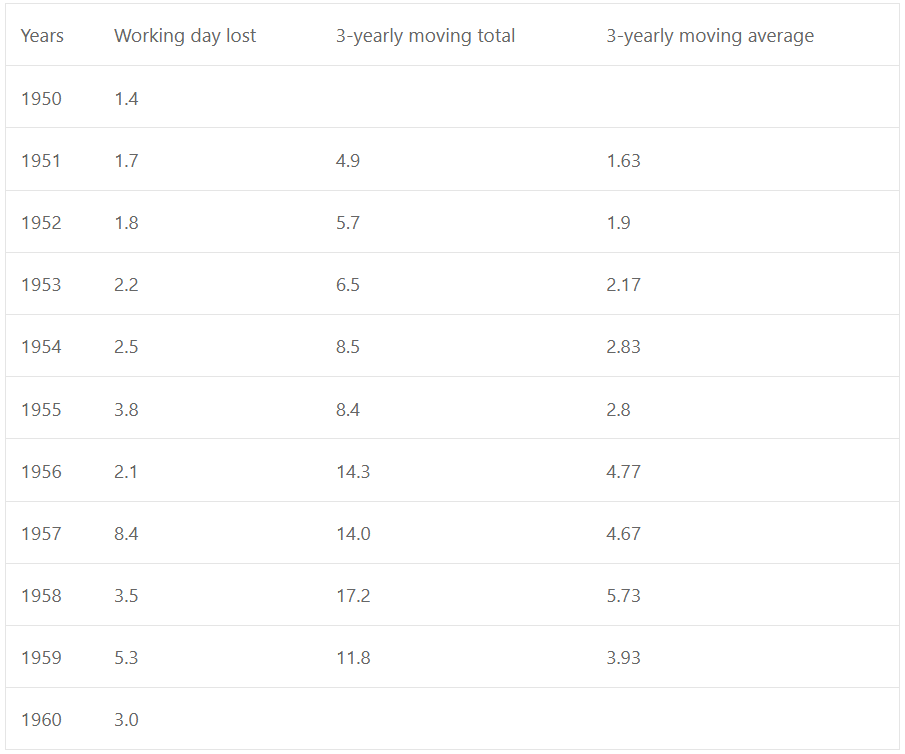
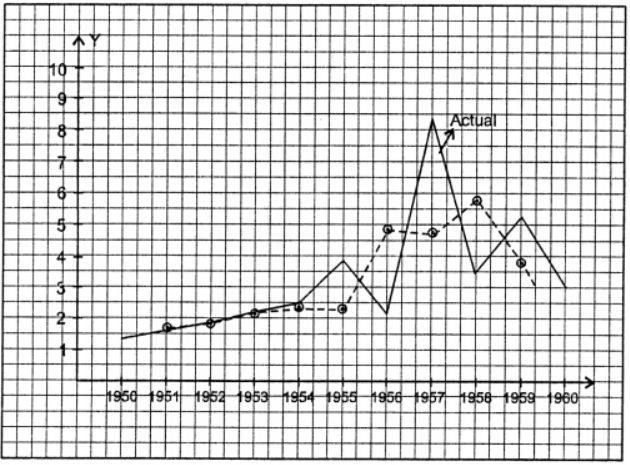
The main purpose in drawing moving average graph is to find the general trend. The purpose is achieved in this case, because the graph shows that the number of working lost during strike is goes on increasing.
Que-17: The profits of a soft drink firm in thousands of rupees during each month of a year were
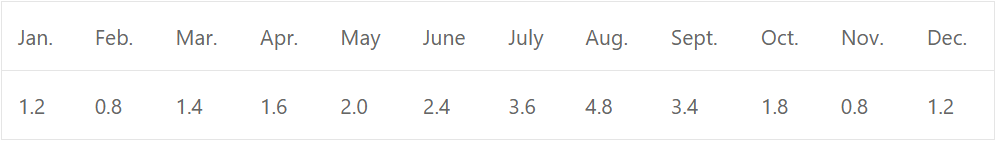
Plot these on a graph. Calculate 4-monthly moving averages and plot these on the same graph. Comment on the general trend.
Sol:
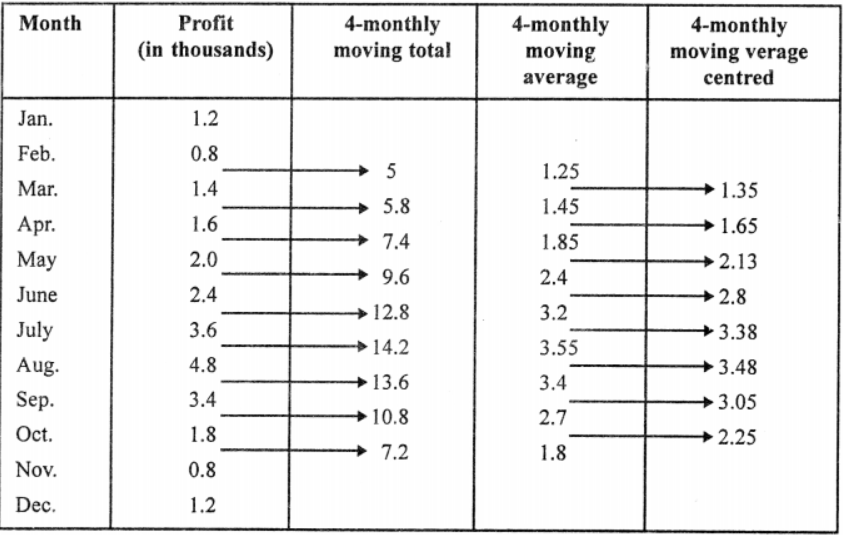
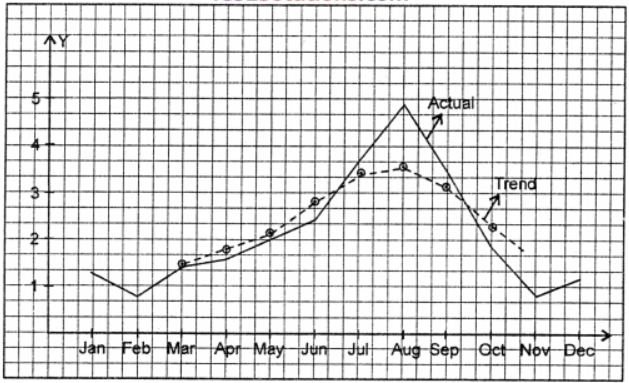
The general comment on trend is that the profits go on increasing from Jan. to August and start decreasing from Sept, to December.
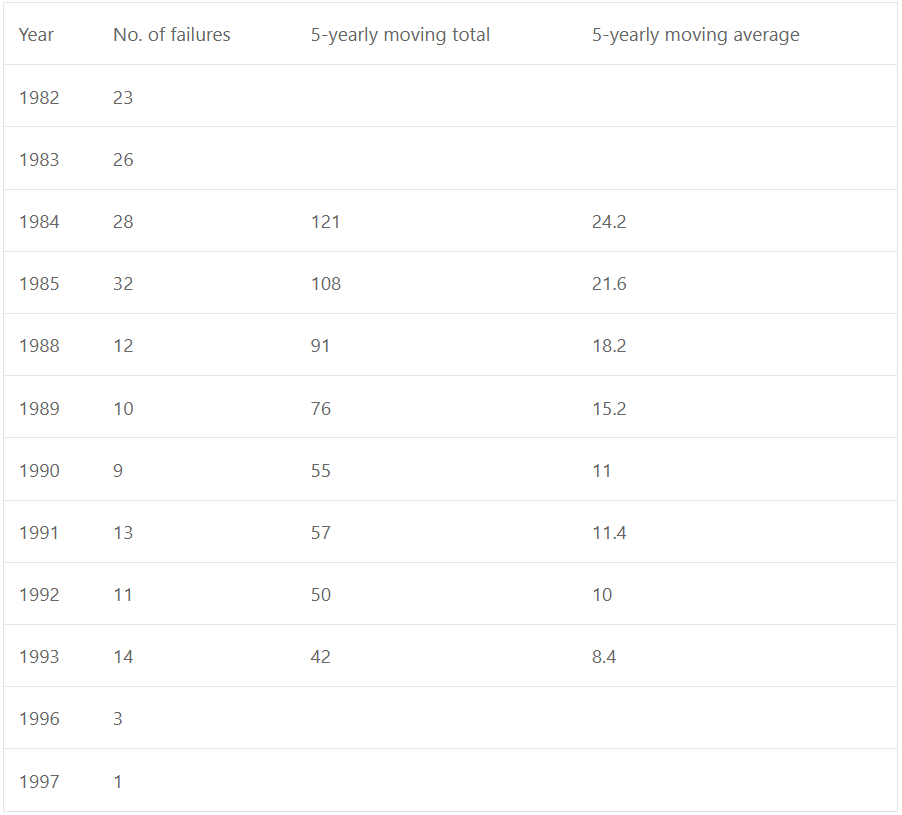
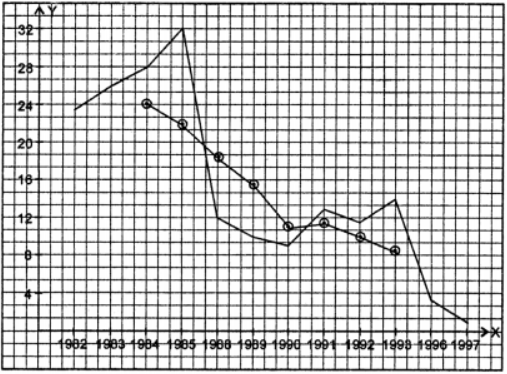
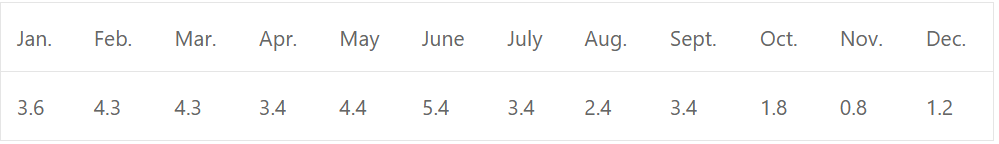
Que-18: Calculate,5-yearIy moving averages for the following data of the commercial and industrial failures in a country from 1982 to 1997.
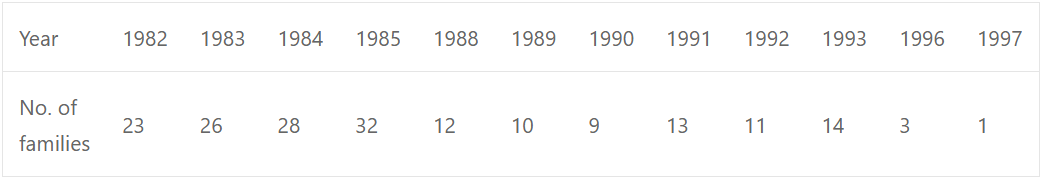
Display the actual and tend values on the same graph using the same axes for both.
Sol:
Que-19: The table given below shows the daily attendance in thousands at a certain exhibition over a period of two weeks :
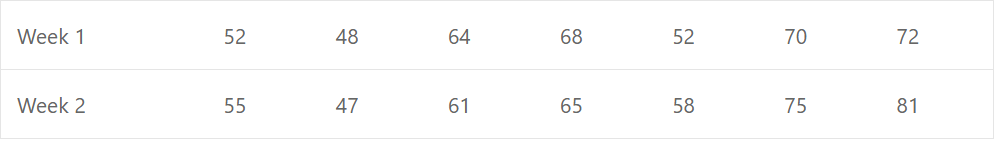
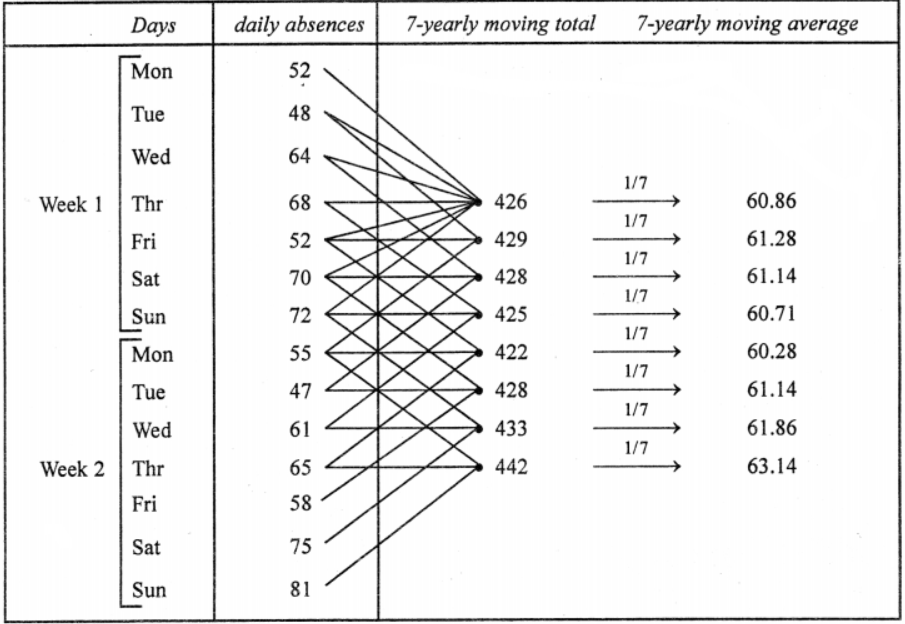
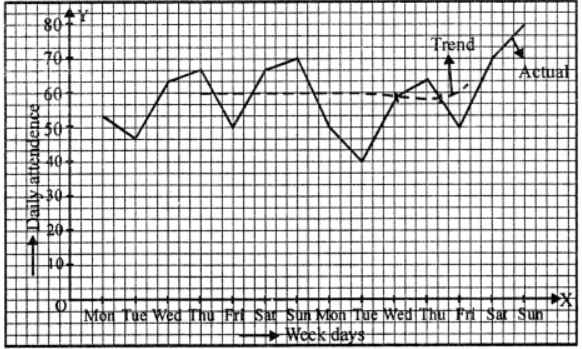
Calculate 7-day moving averages and illustrate these and original information on the same graph using the same scales.
Sol: Calculation of 7-yearly moving average
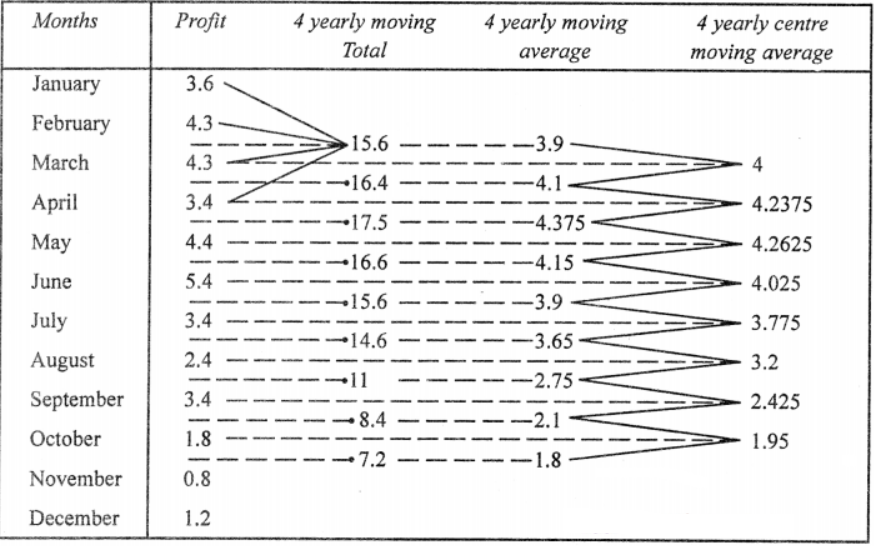
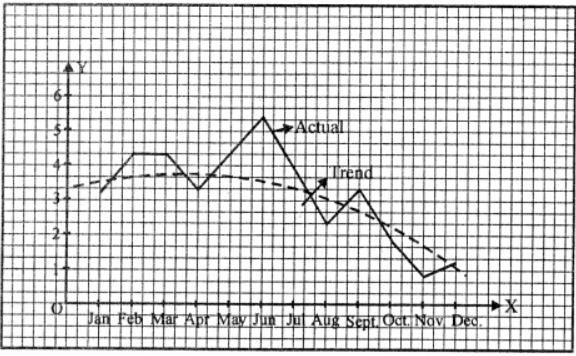
Que-20: The profit of a soft-drink firm (in thousands of rupees) during each month of the year is as given below :
Calculate the 4-monthly moving averages and plot these and the original data on a graph sheet.
Sol: Calculation of 4 yearly moving average
–: End of Moving Average Class 11 OP Malhotra Exe-31A ISC Maths Ch-31 Solutions. :–
Return to :- OP Malhotra ISC Class-11 S Chand Publication Maths Solutions
Please share with your friends
Thanks


