Revision and Self Assessment on Moving Average Class 11 OP Malhotra Exe-31B ISC Maths Solutions Ch-31. In this article you would learn to solve all type questions easily on Moving Average. Step by step solutions of latest textbook has been given as latest syllabus. Visit official Website CISCE for detail information about ISC Board Class-11.

Moving Average Class 11 OP Malhotra Revision and Self Assessment ISC Maths Solutions Ch-31
| Board | ICSE |
| Publications | S Chand |
| Subject | Maths |
| Class | 11th |
| Chapter-31 | Index Numbers |
| Writer | OP Malhotra |
| Exe-31(B) | Revision and Self Assessment. |
Revision and Self Assessment on Moving Average
OP Malhotra ISC Class 11 Maths Solutions
Que-1: The following table gives the recorded monthly sales figures of a certain type of television for the 18-month period commencing 1st January 1989.
| Year | Jan | Feb | March | April | May | June |
|---|---|---|---|---|---|---|
| 1989 | 18 | 16 | 23 | 27 | 28 | 19 |
| 1989 | 31 | 29 | 35 | 27 | 28 | 24 |
| 1990 | 24 | 28 | 29 | 30 | 29 | 22 |
Calculate the 6-monthly moving averages and display these and the original figures on the same graph using the same axes for both. Comment briefly on the purpose of moving average graphs.
Sol: First, list the data in sequence:
18, 16, 23, 27, 28, 19, 31, 29, 35, 27, 28, 24, 24, 28, 29, 30, 29, 22
Now calculate 6-month moving averages:
1st average = (18+16+23+27+28+19)/6 = 131/6 ≈ 21.83
2nd average = (16+23+27+28+19+31)/6 = 144/6 = 24
3rd average = (23+27+28+19+31+29)/6 = 157/6 ≈ 26.17
4th average = (27+28+19+31+29+35)/6 = 169/6 ≈ 28.17
5th average = (28+19+31+29+35+27)/6 = 169/6 ≈ 28.17
6th average = (19+31+29+35+27+28)/6 = 169/6 ≈ 28.17
7th average = (31+29+35+27+28+24)/6 = 174/6 = 29
8th average = (29+35+27+28+24+24)/6 = 167/6 ≈ 27.83
9th average = (35+27+28+24+24+28)/6 = 166/6 ≈ 27.67
10th average = (27+28+24+24+28+29)/6 = 160/6 ≈ 26.67
11th average = (28+24+24+28+29+30)/6 = 163/6 ≈ 27.17
12th average = (24+24+28+29+30+29)/6 = 164/6 ≈ 27.33
13th average = (24+28+29+30+29+22)/6 = 162/6 = 27
These values are plotted against time.
Purpose of Moving Average:
Moving averages help to smooth out short-term fluctuations and highlight long-term trends in the data. They make it easier to understand the general direction of sales over time.
Que-2: The following table gives the numbers of failures of commercial industries in a country during the years 1975 to 1990.
| Year | 1975 | 1976 | 1977 | 1978 | 1979 | |
|---|---|---|---|---|---|---|
| No. of failures | 23 | 26 | 28 | 32 | 20 | |
| Year | 1980 | 1981 | 1982 | 1983 | 1984 | |
| No. of failures | 12 | 12 | 10 | 9 | 13 | |
| Year | 1985 | 1986 | 1987 | 1988 | 1989 | 1990 |
| No. of failures | 11 | 14 | 12 | 9 | 3 | 1 |
Draw a graph illustrating the figures. Calculate the 4-yearly moving average and plot them on the same graph.
Sol: First list data:
23, 26, 28, 32, 20, 12, 12, 10, 9, 13, 11, 14, 12, 9, 3, 1
Now calculate 4-year moving averages:
1st avg = (23+26+28+32)/4 = 109/4 = 27.25
2nd avg = (26+28+32+20)/4 = 106/4 = 26.5
3rd avg = (28+32+20+12)/4 = 92/4 = 23
4th avg = (32+20+12+12)/4 = 76/4 = 19
5th avg = (20+12+12+10)/4 = 54/4 = 13.5
6th avg = (12+12+10+9)/4 = 43/4 = 10.75
7th avg = (12+10+9+13)/4 = 44/4 = 11
8th avg = (10+9+13+11)/4 = 43/4 = 10.75
9th avg = (9+13+11+14)/4 = 47/4 = 11.75
10th avg = (13+11+14+12)/4 = 50/4 = 12.5
11th avg = (11+14+12+9)/4 = 46/4 = 11.5
12th avg = (14+12+9+3)/4 = 38/4 = 9.5
13th avg = (12+9+3+1)/4 = 25/4 = 6.25
Plot both original data and moving averages on the graph.
Moving averages smooth fluctuations and clearly show the long-term trend of industrial failures.
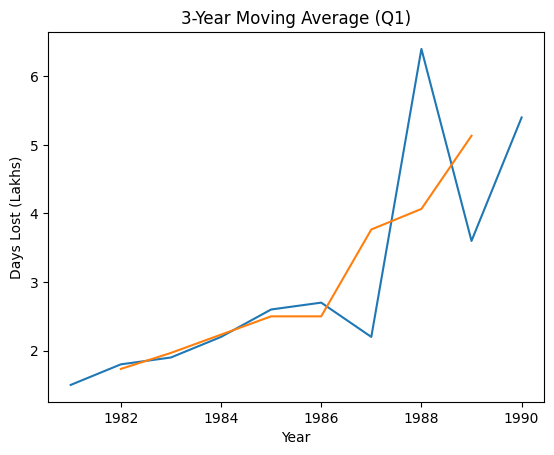
Que-3: The average number, in lakhs, of working days lost in strikes during each year of the period 1981–90 was:
| Year | 1981 | 1982 | 1983 | 1984 | 1985 | 1986 | 1987 | 1988 | 1989 | 1990 |
|---|---|---|---|---|---|---|---|---|---|---|
| Days lost | 1.5 | 1.8 | 1.9 | 2.2 | 2.6 | 2.7 | 2.2 | 6.4 | 3.6 | 5.4 |
Calculate the 3-yearly moving average and draw the moving average graph.
Sol: Given data:
1.5, 1.8, 1.9, 2.2, 2.6, 2.7, 2.2, 6.4, 3.6, 5.4
Now calculate 3-year moving averages:
1st = (1.5 + 1.8 + 1.9)/3 = 5.2/3 = 1.73
2nd = (1.8 + 1.9 + 2.2)/3 = 5.9/3 = 1.97
3rd = (1.9 + 2.2 + 2.6)/3 = 6.7/3 = 2.23
4th = (2.2 + 2.6 + 2.7)/3 = 7.5/3 = 2.50
5th = (2.6 + 2.7 + 2.2)/3 = 7.5/3 = 2.50
6th = (2.7 + 2.2 + 6.4)/3 = 11.3/3 = 3.77
7th = (2.2 + 6.4 + 3.6)/3 = 12.2/3 = 4.07
8th = (6.4 + 3.6 + 5.4)/3 = 15.4/3 = 5.13
These averages are plotted against middle years to draw the graph.
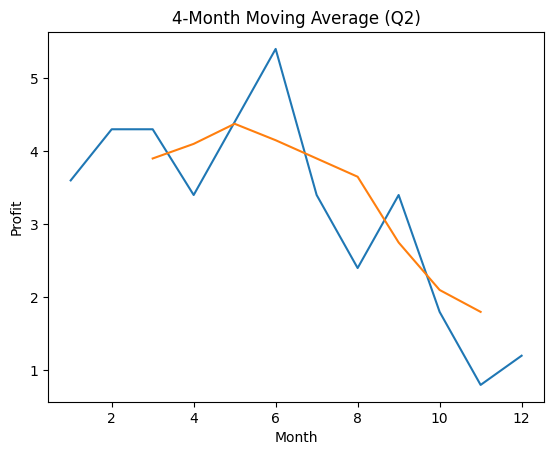
Que-4: The profit of a soft drink firm (in thousands of rupees) during each month of the year is as given below:
| Month | Jan | Feb | Mar | Apr | May | June | July | Aug | Sep | Oct | Nov | Dec |
|---|---|---|---|---|---|---|---|---|---|---|---|---|
| Profit | 3.6 | 4.3 | 4.3 | 3.4 | 4.4 | 5.4 | 3.4 | 2.4 | 3.4 | 1.8 | 0.8 | 1.2 |
Calculate the 4-monthly moving averages and plot graph.
Sol: First 4-month average:
(3.6 + 4.3 + 4.3 + 3.4)/4 = 15.6/4 = 3.9
Next:
(4.3 + 4.3 + 3.4 + 4.4)/4 = 16.4/4 = 4.1
Similarly:
(4.3 + 3.4 + 4.4 + 5.4)/4 = 17.5/4 = 4.38
(3.4 + 4.4 + 5.4 + 3.4)/4 = 16.6/4 = 4.15
(4.4 + 5.4 + 3.4 + 2.4)/4 = 15.6/4 = 3.9
(5.4 + 3.4 + 2.4 + 3.4)/4 = 14.6/4 = 3.65
(3.4 + 2.4 + 3.4 + 1.8)/4 = 11/4 = 2.75
(2.4 + 3.4 + 1.8 + 0.8)/4 = 8.4/4 = 2.1
(3.4 + 1.8 + 0.8 + 1.2)/4 = 7.2/4 = 1.8
Plot both original and averages on graph.
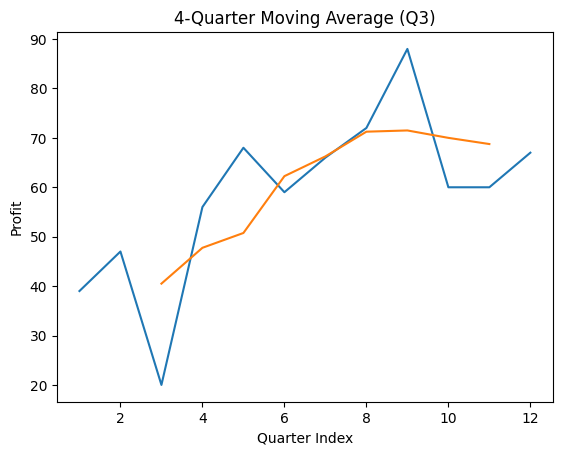
Que-5: The quarterly profits of a small scale industry (in thousands of rupees) is as follows:
| Year | Q1 | Q2 | Q3 | Q4 |
|---|---|---|---|---|
| 2012 | 39 | 47 | 20 | 56 |
| 2013 | 68 | 59 | 66 | 72 |
| 2014 | 88 | 60 | 60 | 67 |
Calculate 4-quarterly moving averages.
Sol: Example:
(39+47+20+56)/4 = 162/4 = 40.5
(47+20+56+68)/4 = 191/4 = 47.75
(20+56+68+59)/4 = 203/4 = 50.75
(56+68+59+66)/4 = 249/4 = 62.25
(68+59+66+72)/4 = 265/4 = 66.25
(59+66+72+88)/4 = 285/4 = 71.25
(66+72+88+60)/4 = 286/4 = 71.5
(72+88+60+60)/4 = 280/4 = 70
(88+60+60+67)/4 = 275/4 = 68.75
Plot graph accordingly.
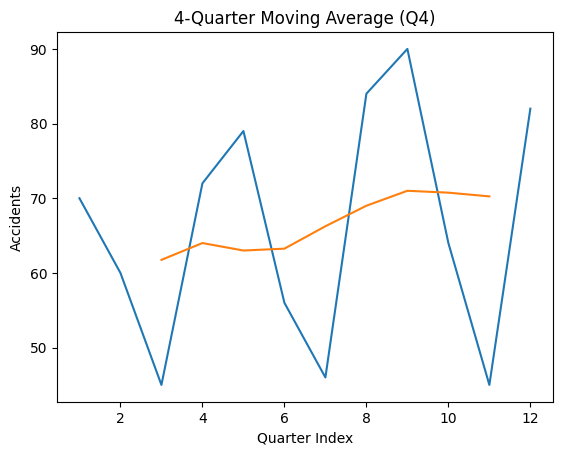
Que-6: The number of road accidents in the city due to rash driving over a period of 3 years is given below:
| Year | Jan–Mar | Apr–June | July–Sept | Oct–Dec |
|---|---|---|---|---|
| 2010 | 70 | 60 | 45 | 72 |
| 2011 | 79 | 56 | 46 | 84 |
| 2012 | 90 | 64 | 45 | 82 |
Calculate four quarterly moving averages and illustrate graph.
Sol: Take 4 consecutive quarters:
(70+60+45+72)/4 = 247/4 = 61.75
(60+45+72+79)/4 = 256/4 = 64
(45+72+79+56)/4 = 252/4 = 63
(72+79+56+46)/4 = 253/4 = 63.25
(79+56+46+84)/4 = 265/4 = 66.25
(56+46+84+90)/4 = 276/4 = 69
(46+84+90+64)/4 = 284/4 = 71
(84+90+64+45)/4 = 283/4 = 70.75
(90+64+45+82)/4 = 281/4 = 70.25
Plot both original data and averages on graph.
Moving averages help to identify long-term trends and remove fluctuations.
–: End Moving Average Class 11 OP Malhotra Exe-31B ISC Maths Ch-31 Solutions :–
Return to :- OP Malhotra ISC Class-11 S Chand Publication Maths Solutions
Thanks
Please share with your friends


