Spearman’s Rank Correlation Analysis Class 11 OP Malhotra Exe-29B ISC Maths Ch-29 Solutions. In this article you would learn about Spearman’s Rank Correlation Coefficient. Step by step solutions of latest textbook has been given as latest syllabus. Visit official Website CISCE for detail information about ISC Board Class-11 Mathematics.
![]()
Spearman’s Rank Correlation Analysis Class 11 OP Malhotra Exe-29B ISC Maths Solutions Ch-29
| Board | ISC |
| Publications | S Chand |
| Subject | Maths |
| Class | 11th |
| Chapter-29 | Correlation Analysis |
| Writer | O.P. Malhotra |
| Exe-29(B) | Spearman’s Rank Correlation Coefficient |
Spearman’s Rank Correlation Coefficient.
Correlation Analysis Class 11 OP Malhotra Exe-29B ISC Maths Ch-29 Solutions.
Find Rank Correlation Coefficient by Spearman’s formula in the following questions.
TYPE 1. [Based on the formula R = 1 – {6ΣD²}/{n(n²−1)}]
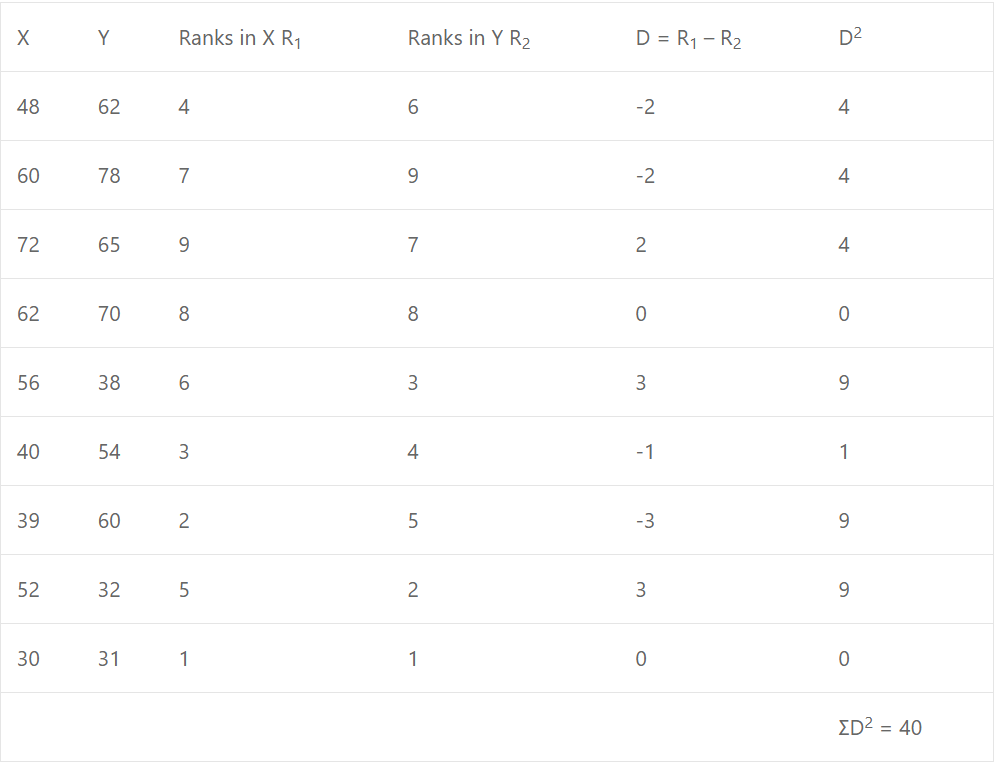
Que-1: The marks obtained by nine students in Physics and Mathematics are given below :
Calculate spearman’s coefficient correlation and interpret the result.
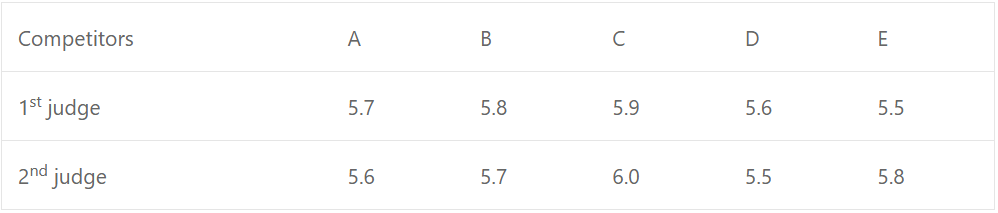
Sol: We construct table of values is given as under:
Spearman coeff. of correlation R = [1 – {6ΣD²}/{n(n²−1)}] = 1 – {(6×40)/{9(9²−1)} = 1 – {(6×40)/(9×80)} = 2/3 = 0.667
This shows that there is a positive moderate relationship between marks in Physics and Mathematics.
Que-2: In a skating competition the judges gave the five competitors the following marks :
Calculate a coefficient of rank correlation.
Sol: The table of values is given as under :
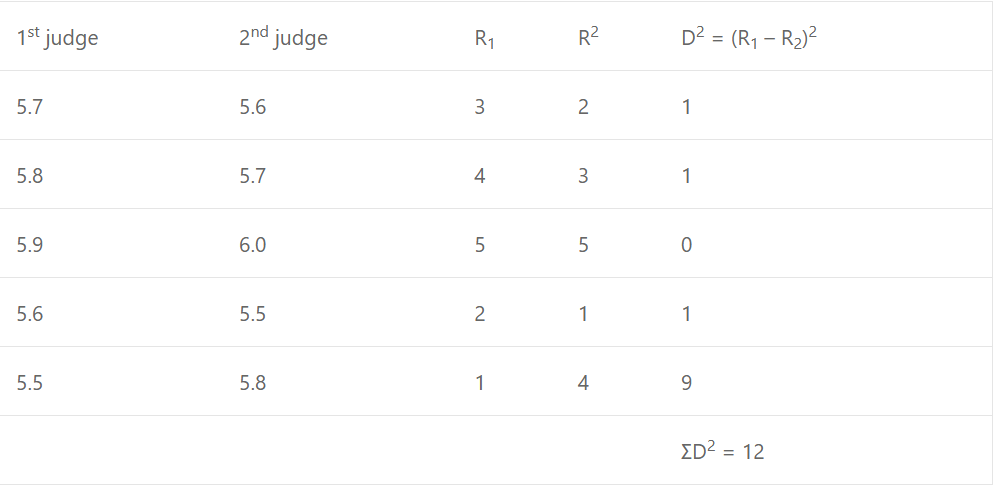
∴ Spearman coeff. of correlation R = [1 – {6ΣD²}/{n³−n)}] ⇒ R = 1 – {(6×12)/(5³−5)}
= 1 – (3/5) = 2/5 = 0.4
Que-3: The marks in history and mathematics of twelve students in a public examination are given in the table below :
Calculate a coefficient of correlation by ranks. What deduction can be made from the result?
Sol: The table of values is given as under :
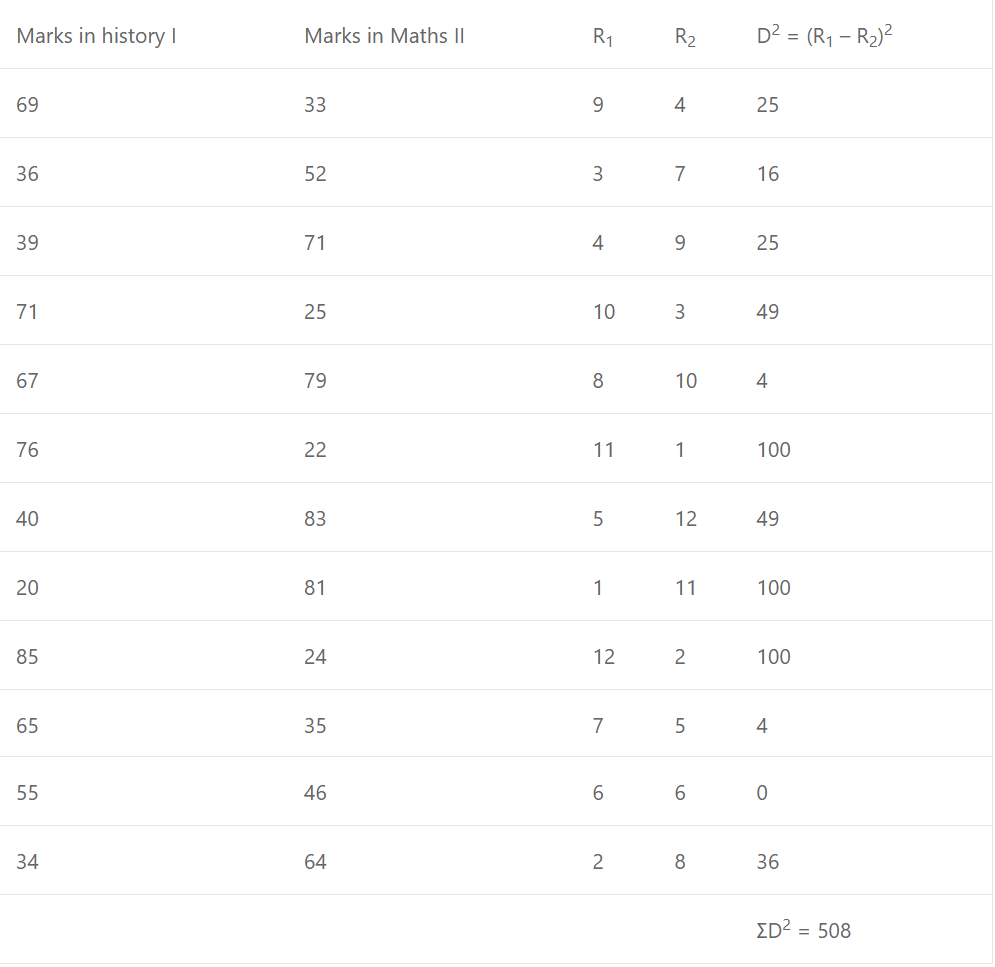
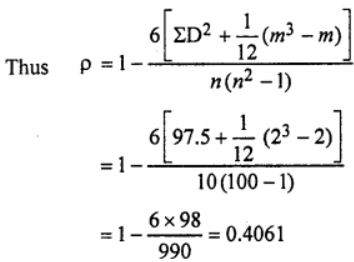
ρ = [1 – {6ΣD²}/{n³−n)}] = 1 – {(6×508)/(12³−12)} = 1 – (3048/1716) = – 0.776
So there is a negative correlation of higher degree which means that a good student of history is a very bad student of mathematics and vice-versa.
Que-4: The marks given to five competitors by three different judges were as follows :
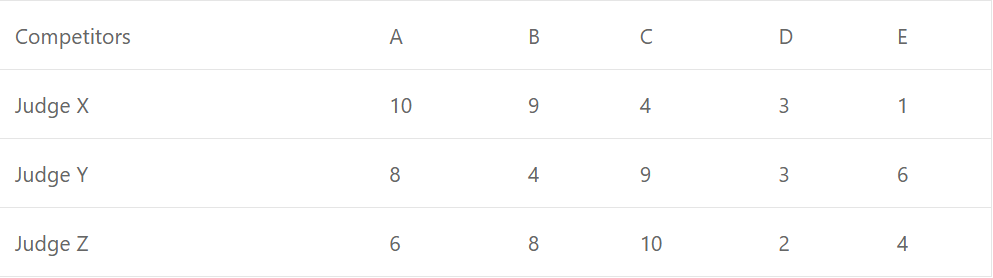
The result was decided by the average mark of the two judges whose marks showed the best correlation. Calculate :
(i) the coefficient of correlation by ranks for each pair of judges ;
(ii) the final order of the competitors.
Sol: The table of values is given as under :
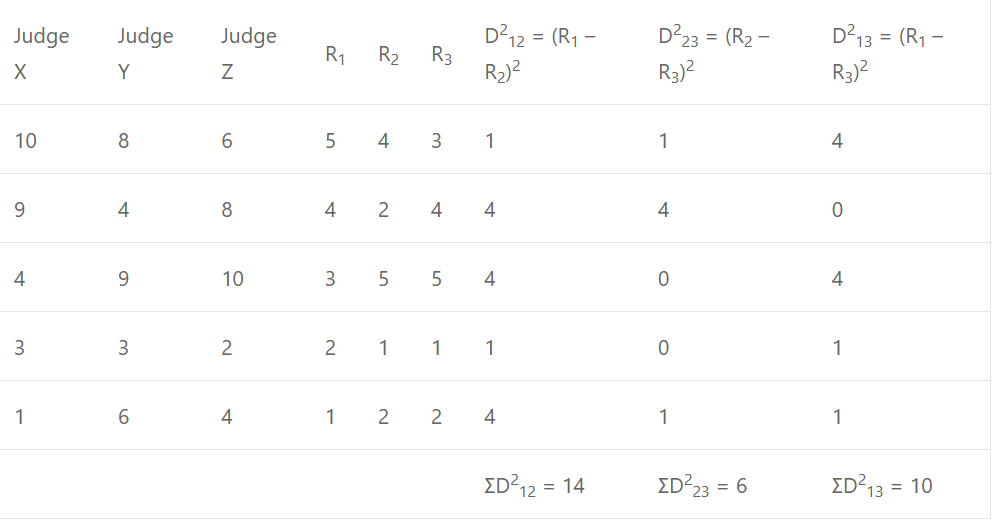
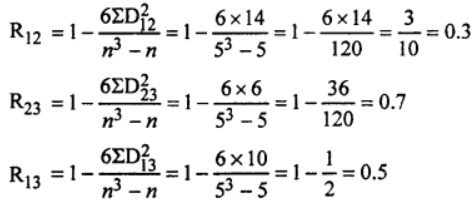
Here value of R23 is maximum. Thus the best correlation was between the marks of Judges Y and Z.
Thus the marks obtained by competitors A, B, C, D, E are 14, 12, 19, 5 and 10. Hence the final order of the competitors are C, A, B, E and D.
Que-5: The coefficient of rank correlation between the marks in Statistics and Mathematics obtained by a certain group of students is 2/3 and the sum of the squares of the differences in ranks is 55. Find the number of students in the group.
Sol: Let n be the required no. of students in the group.
Given ρ = 2/3 and ΣD² = 55
ρ = [1 – {6ΣD²}/{n³−n)}]
2/3 = 1 – [(6×5)/{n³−n)}]
330/{n³−n)} = 1 – (2/3) = 1/3
990 = {n³−n)}
n = 10
Thus, the required no. of students be 10.
TYPE 2. (using correlation factor)
Que-6: The final positions of twelve clubs in a football league and the average attendances at their home matches were as follows :
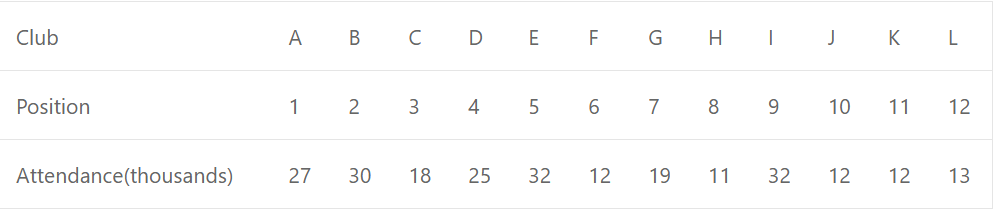
Calculate a coefficient of correlation by ranks and comment on your result.
What other factors do you think might affect the number of spectators apart from the positions of the clubs in the league?
Sol: We construct the rank table as follows :
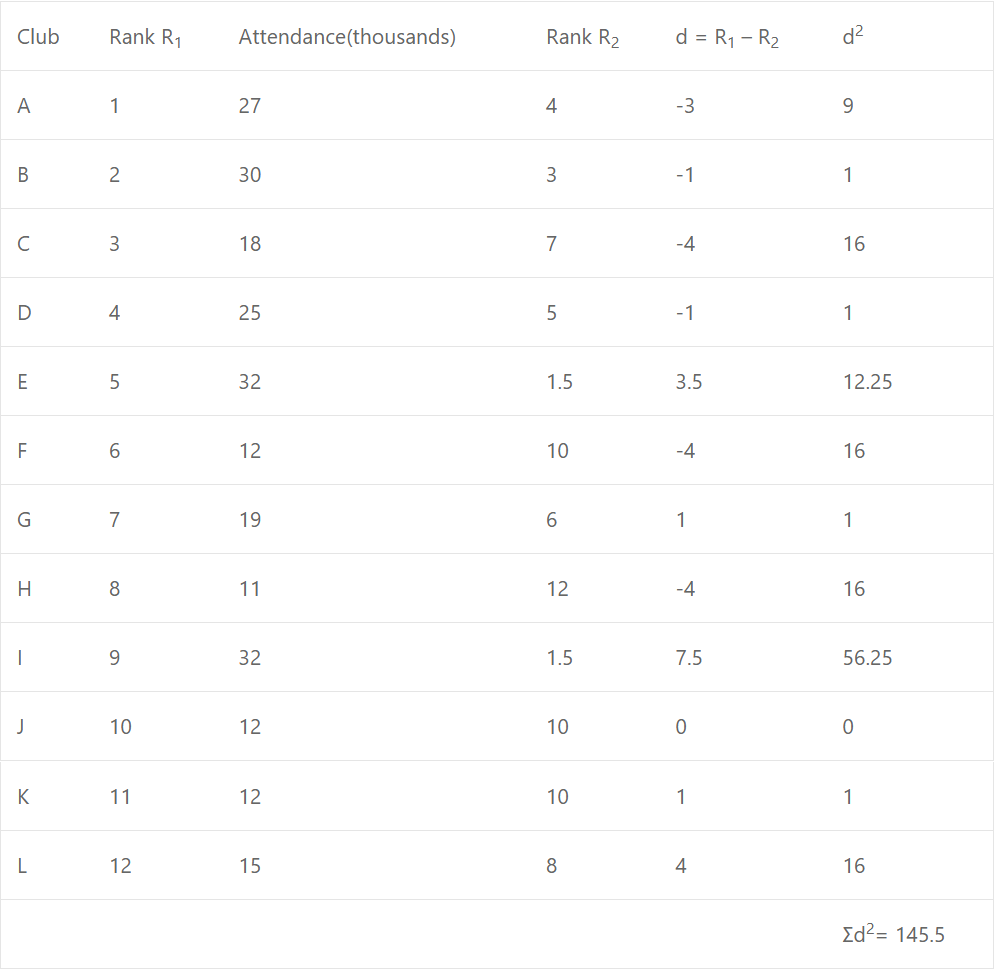
There are 2 ties in Ranks R2 out of which one tie of 2 items and other tie of 3 items.
Given ρ = 2/3 and ΣD² = 55
ρ = [1 – {6ΣD²}/{n³−n)}]
2/3 = 1 – [(6×5)/{n³−n)}]
330/{n³−n)} = 1 – (2/3) = 1/3
990 = {n³−n)}
n = 10
Thus, the required no. of students be 10.Since R = +0.4825 which indicates a moderate positive relation. Apart from position of clubs in the league, many other factors like days of week, whether, accessibility of stadium affect the number of spectators.
Que-7: The competitors in a beauty contest were awarded marks out of 20 by three judges with the following results :
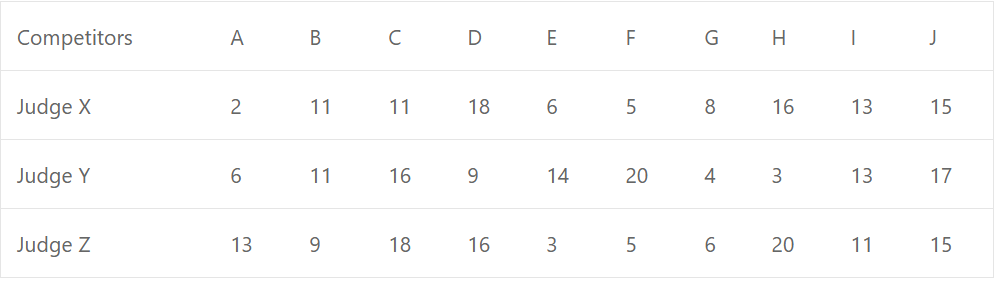
Determine the rank correlation coefficient in order to decide which two judges have the nearest approach to common taste in beauty. State the final order of the competitors if the result of the competition was decided by the average mark of the two judges having the nearest approach to the common taste in beauty.
Sol: The table of values is given as under :
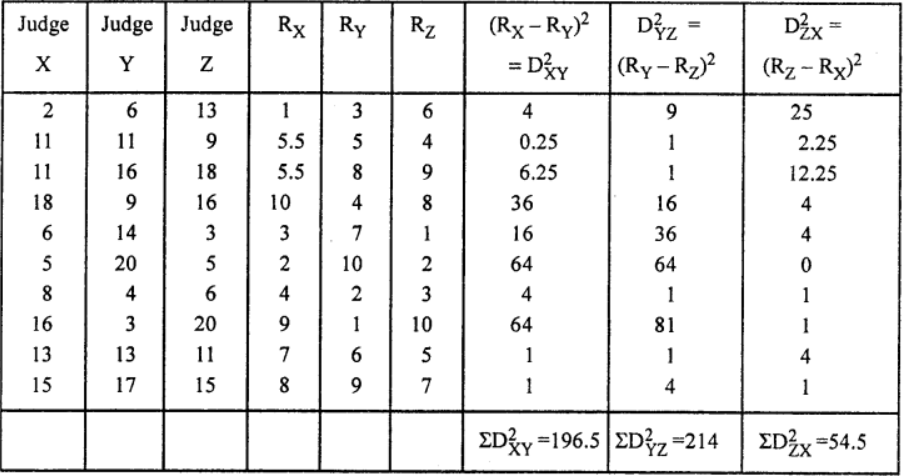
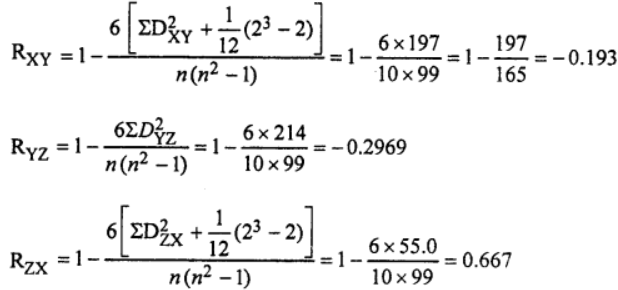
Thus RZX is Maximum. So we conclude that the pair of first and third judges has the nearest approach to beauty.
Thus the total scores of competitors A, B, C, D, E, F G, H, I and J are :
15, 20, 29, 34, 9, 10, 14, 36, 24, 30 .
Thus the final order of competitors are :
H, D, J, C, I, B, A, G, F and E.
Que-8: (i) Ten recruits were subjected to a selection test to ascertain their suitability for a certain course of training. At the end of the training, they were given a proficiency test.
The marks, secured by recruits in the selection test x and proficiency test (y) are given below :
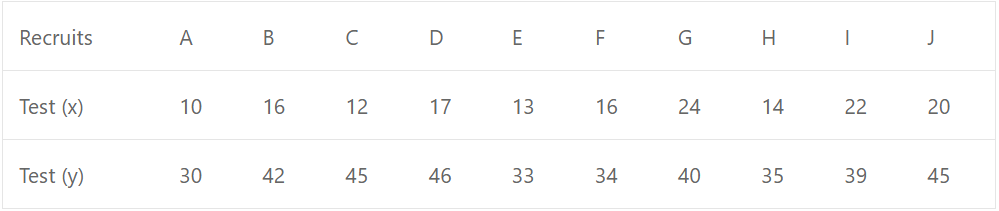
Calculate a coefficient of correlation by rank and comment on your result.
(ii) Describe the correlation you would expect to find between :
(a) the ages and weights of children under six year old,
(b) the width of a river at different points and the distance of these points from the sea,
(c) the amount of oxygen in the air at a place and its height above sea level.
Note. Use Spearman’s formula in (i).
Sol:
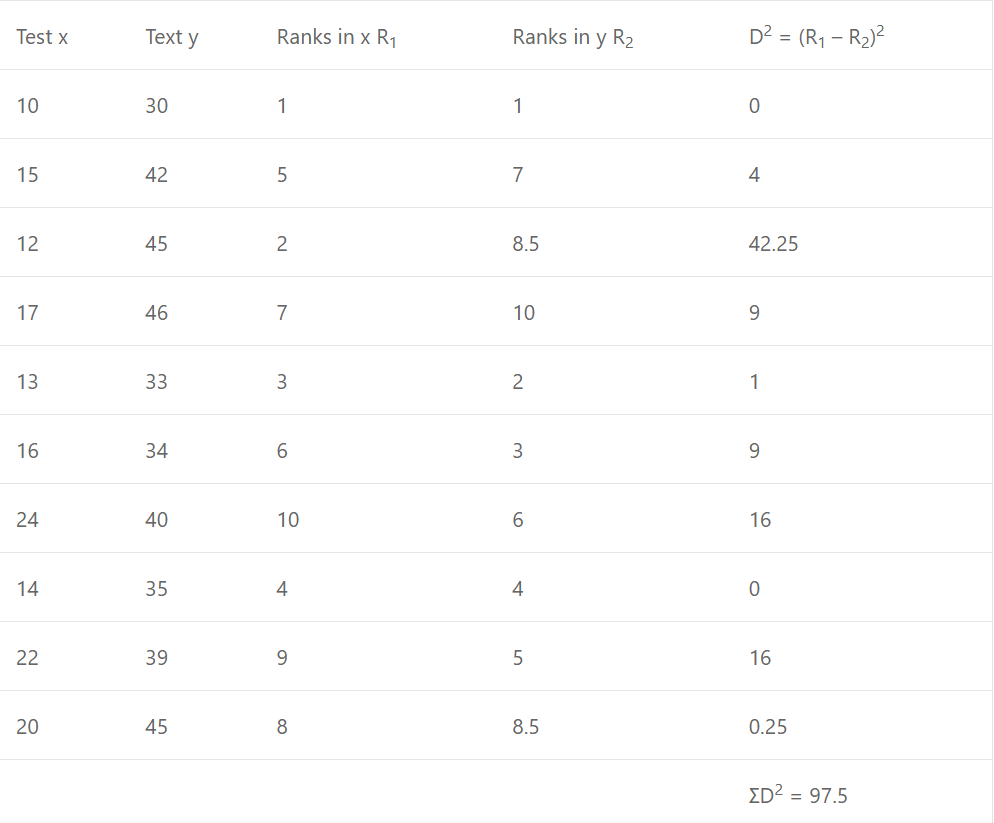
which shows that there is a substantial relationship between X and Y.
(ii) (a) As age increases, weight of children are also increases so there is a direct relationship between age and weight of children.
(b) There is an inverse correlation between them.
(c) There is no correlation as amount of oxygen in the air at a place is not only depends upon the height but also on the factors like pollution etc.
Que-9: The following table gives the record of the heights of eight athletes and the measurements of their long jump and high jump to the nearest cm :
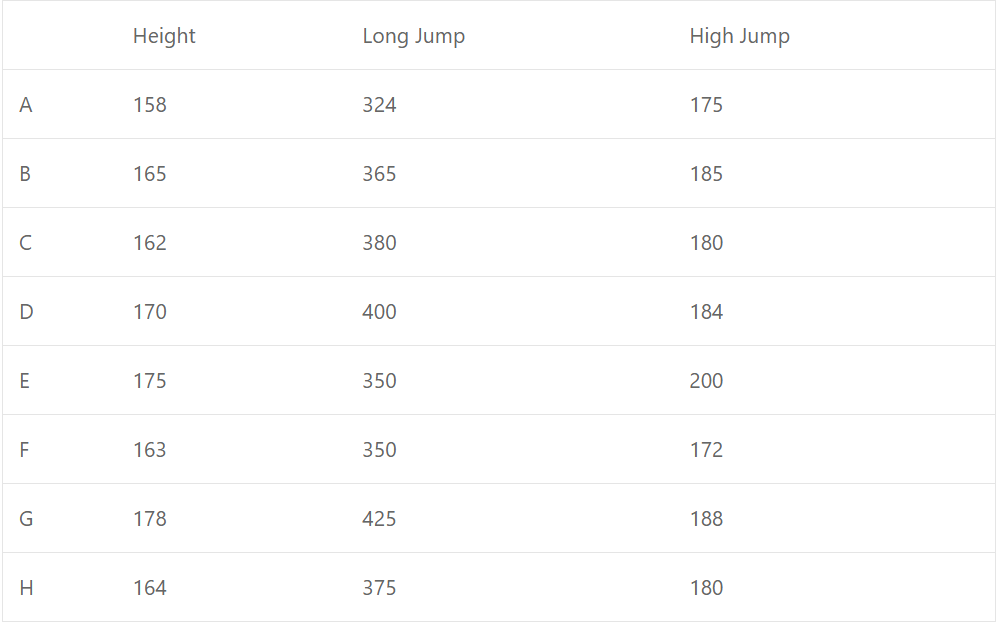
Calculate the coefficient of rank correlation between height and long jump and between height and high jump. Comment on the result.
Sol: We construct the following table as under :
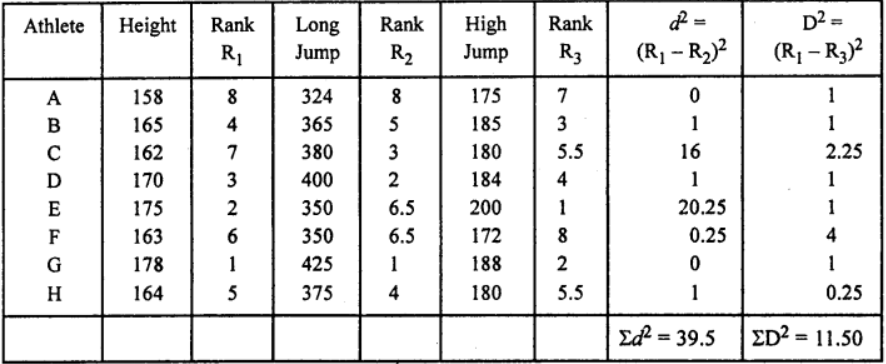
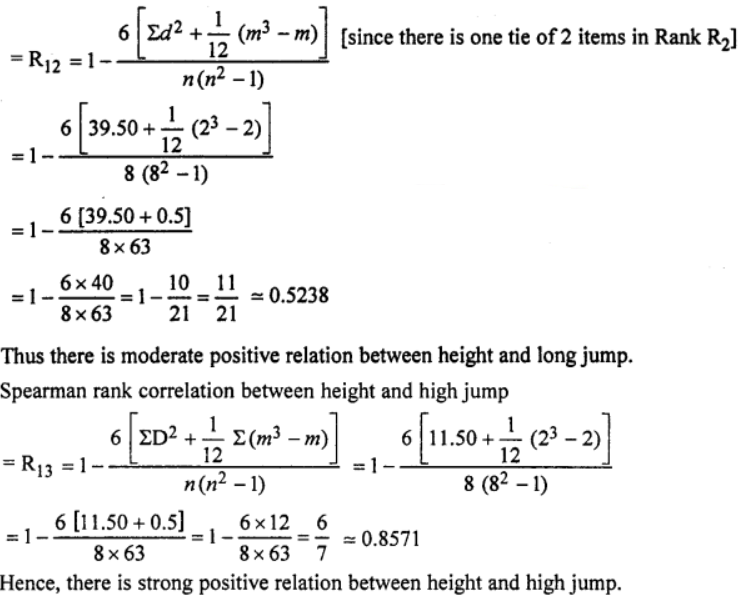
Thus spearman rank correlation between height and long jump
–: End of Spearman’s Rank Correlation Analysis Class 11 OP Malhotra Exe- 29B ISC Maths. :–
Return to :- OP Malhotra ISC Class-11 S Chand Publication Maths Solutions
Please share with your friends
Thanks


