Statistics Class 11 OP Malhotra Exe-28D ISC Maths Ch-28 Solutions. In this article you would learn about Locating More Graphically. Step by step solutions of latest textbook has been given as latest syllabus. Visit official Website CISCE for detail information about ISC Board Class-11 Mathematics.
Statistics Class 11 OP Malhotra Exe-28D ISC Maths Solutions Ch-28
| Board | ISC |
| Publications | S Chand |
| Subject | Maths |
| Class | 11th |
| Chapter-28 | Statistics |
| Writer | O.P. Malhotra |
| Exe-28(D) | Locating Mode Graphically |
Locating Mode Graphically
Statistics Class 11 OP Malhotra Exe-28D ISC Maths Ch-28 Solutions.
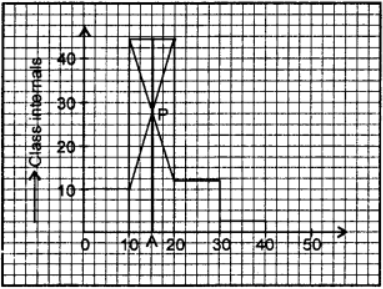
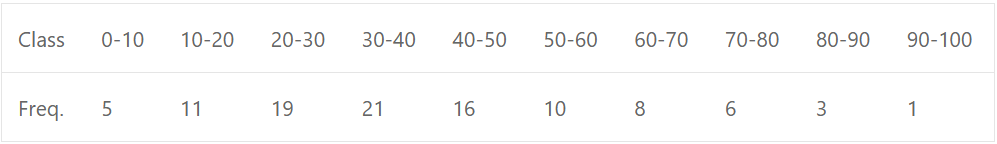
Que-1: Find the mode of the given distribution by drawing a histogram.
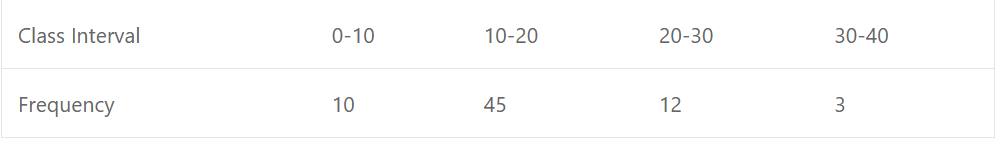
Sol: Draw rectangles corresponding to each class interval with heights corresponds to their frequencies. Here the modal class be 10-20. Now join the ends of the opposite rectangles in which rectangle corresponding to modal class be sandwitched between them. Then draw a ⊥ from point of intersection P to x-axis. Thus x-coordinate of point A gives the required mode.
Clearly Mode = 15.15
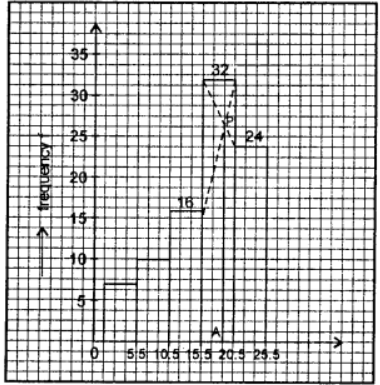
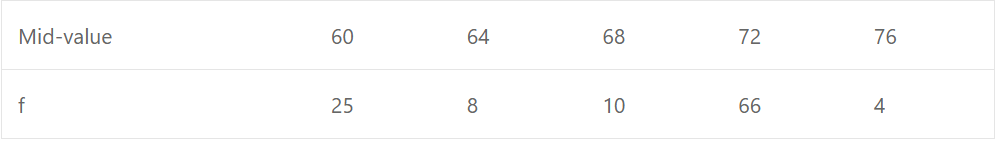
Que-2:
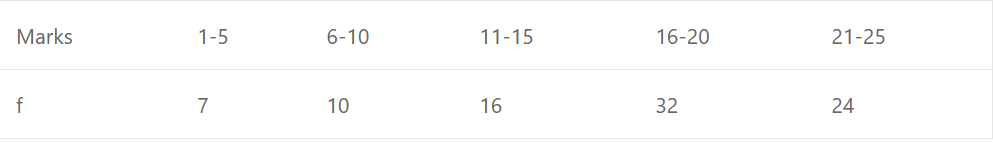
Sol: Here we convert first of all, discontinuous to continuous distribution.
Here adjustment factor = (6−5)/2 = 0.5
we subtract 0.5 from each lower limit and add 0.5 to each upper limit of each class interval.
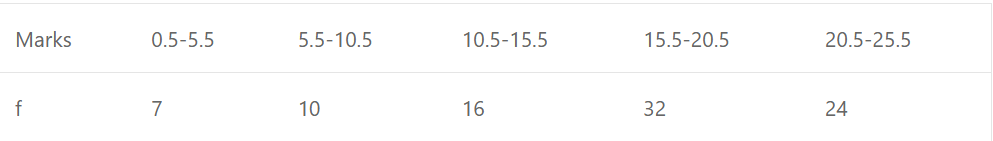
Draw rectangles corresponding to each class interval with heights corresponds to their frequencies. Here modal class be 16 – 20. Join the ends of the opposite rectangle in which rectangle corresponding to modal class be sandwitched between them. Then draw a ⊥ from point of intersection P meeting x-axis at A. Then abscissa of P gives the required mode.
∴ Required mode = 18.8
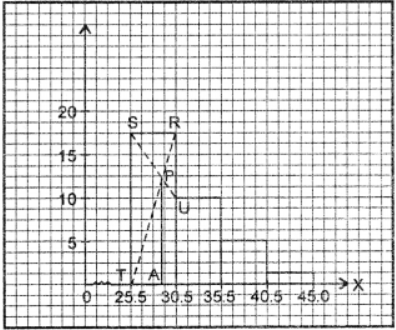
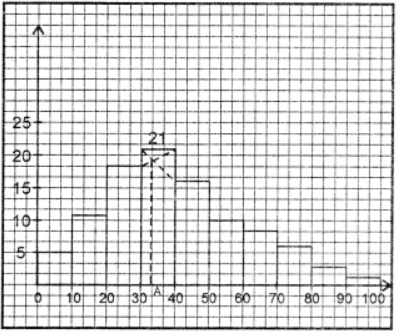
Que-3:
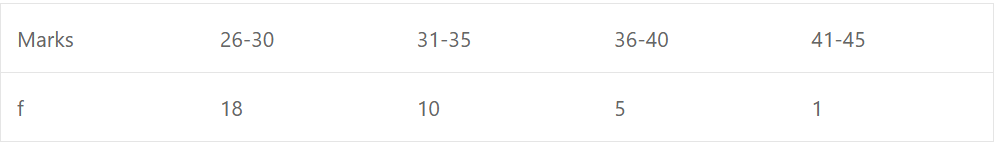
Sol: We make first of all, discontinuous into continuous distribution by using adjustment factor.
Here adjustment factor = (31−30)/2 = 0.5. So we subtract 0.5 from lower limit and add 0.5 to upper limit of each class interval.
Draw rectangles corresponding to each class interval with heights corresponds to their frequencies. Here modal class be 25.5 – 30.5.
Join RT and SU, draw a ⊥ from point of intersection P meeting x-axis at A.
Then x-coordinate of point A gives the required mode.
∴ Mode = 28.96
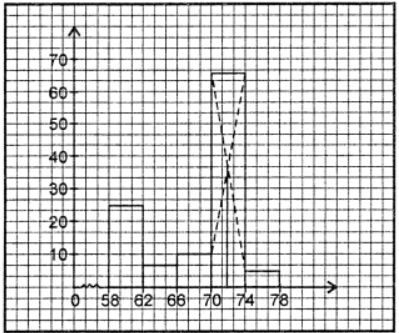
Que-4:
Sol: The frequency distribution table is given as under:
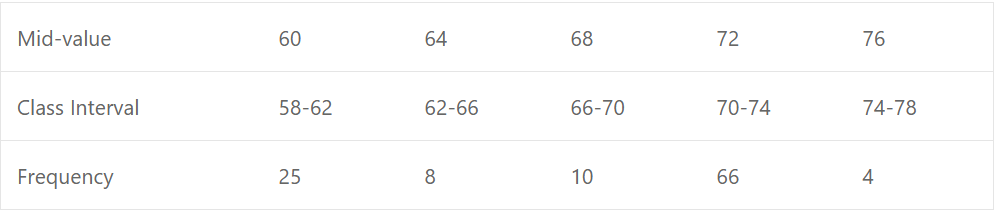
Draw rectangles corresponding to each class interval with heights corresponding to their frequencies. Now join the ends of the opposite rectangles in which rectangle corresponds to modal class be sandwitched between them. Then draw a ⊥ from the point of intersection P meeting x-axis at A. Then abscissa of point A gives the required mode. ∴ Mode = 71.90
Que-5:
Sol: Draw rectangles corresponding to each class interval with heights corresponding to their frequencies. Now join the ends of the opposite rectangles in which rectangle corresponds to modal class be sandwitched between them. Then draw a ⊥ from the point of intersection P meeting x-axis at A. Then abscissa of point A gives the required mode.
Thus required mode = 32.8
Que-6: The daily profits in rupees of 100 shops are distributed as under :
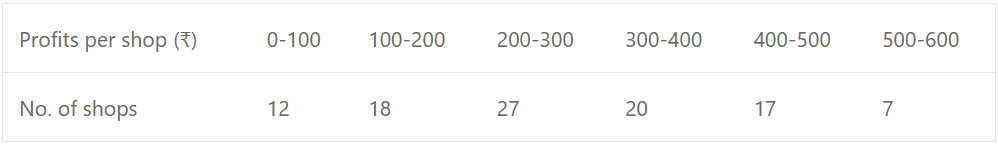
Draw a histogram of the data and find the modal value. Verify by direct calculation.
Sol: Draw rectangles corresponding to each class interval with heights corresponding to their frequencies. Now join the ends of the opposite rectangles in which rectangle corresponds to modal class be sandwitched between them. Then draw a ⊥ from the point of intersection P meeting x-axis at A. Then abscissa of point A gives the required mode.
∴ Mode = 256.25
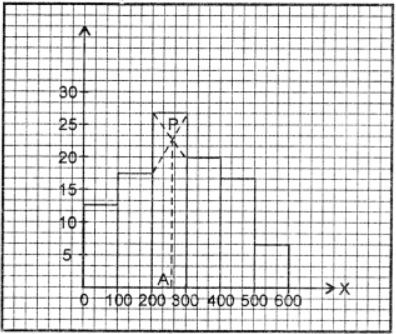
By Inspection, modal class be 200 – 300.
Here l = 200; fm = 27 ; fm-1 = 18 ; fm+1 = 20 ; i = 100
∴ Mode = l + [{fm−(fm−1)}/{(2fm)−(fm−1)−(fm+1)}] × i
= 200 + {(27−18)/(54−18−20)} × 100
= 200 + 56.25 = 256.25
Que-7: Determine the value of mode of the following distribution graphically and verify the result.
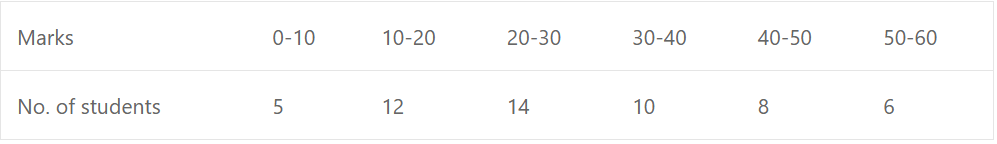
Sol: Draw rectangles corresponding to each class interval with heights corresponding to their frequencies. Now join the ends of the opposite rectangles in which rectangle corresponds to modal class be sandwitched between them. Then draw a ⊥ from the point of intersection P meeting x-axis at A. Then abscissa of point A gives the required mode.
Mode = 23.3
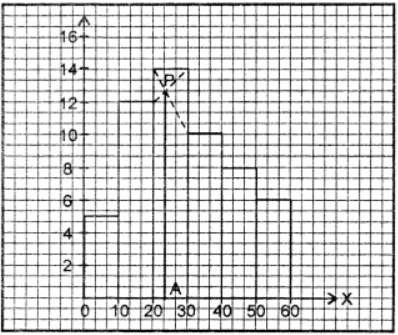
By inspection, modal class be 20 – 30,
we have, l = 20 ; fm = 14 ; fm-1 = 12 ; fm+1 = 10 ; i = 10
∴ Mode = l + [{fm−(fm−1)}/{(2fm)−(fm−1)−(fm+1)}] × i
= 20 + (14−12)/(28−12−10) × 10
= 20 + 3.33 = 23.33
Que-8: (i) In an asymmetrical distribution mean is 58 and median is 61 . Calculate mode.
(ii) If mode in a tolerably asymmetrical distribution is 12 and median is 16 , what would be the most probable mean?
(iii) Find the median if mean is 40 and mode is 36.
Sol: (i) We know that mode = 3 median – 2 man
∴ Mode = 3 × 61 – 2 × 58 = 183 – 116 = 67
(ii) Given mode = 12 ; median = 16
since mode = 3 median – 2 mean
⇒ 12 = 3 × 16 – 2 mean
⇒ 2 mean = 48 – 12 = 36
⇒ mean = 18
(iii) Given mean = 40 ; mode = 36
We know that, Mode = 3 median – 2 mean
⇒ 36 = 3 median – 2 × 40
⇒ 3 median = 36 + 80 = 116
⇒ median = 116/3 = 38.67
–: End of Statistics Class 11 OP Malhotra Exe-28D ISC Maths Ch-28 Solutions. :–
Return to :- OP Malhotra ISC Class-11 S Chand Publication Maths Solutions
Please share with your friends
Thanks


