ML Aggarwal Data Handling Exe-19.1 Class 8 ICSE Ch-19 Maths Solutions. We Provide Step by Step Answer of Exe-19.1 Questions for Data Handling as council prescribe guideline for upcoming board exam. Visit official Website CISCE for detail information about ICSE Board Class-8.
ML Aggarwal Data Handling Exe-19.1 Class 8 ICSE Maths Solutions
| Board | ICSE |
| Publications | Avichal Publishig Company (APC) |
| Subject | Maths |
| Class | 8th |
| Chapter-19 | Data Handling |
| Writer | ML Aggarwal |
| Book Name | Understanding |
| Topics | Solution of Exe-19.1 Questions |
| Edition | 2023-2024 |
Data Handling Exe-19.1
ML Aggarwal Class 8 ICSE Maths Solutions
Page-326
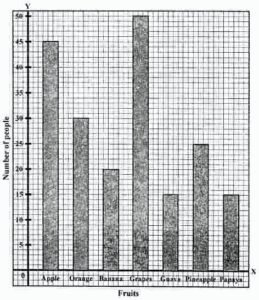
Question 1. The result of a survey of 200 people about their favourite fruit is given below:
| Fruit | Apple | Orange | Banana | Grapes | Guava | Pineapple | Papaya |
| Number of people | 45 | 30 | 20 | 50 | 15 | 25 | 15 |
Represent the above data by a bar graph.
Answer:
| Fruit | Apple | Orange | Banana | Grapes | Guava | Pineapple | Papaya |
| Number of people | 45 | 30 | 20 | 50 | 15 | 25 | 15 |
The bar graph is given below:
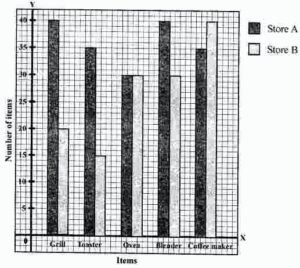
Question 2. Mr Khurana has two kitchen appliance stores. He compares the sales of two stores during a month and recovered as given below:
| Item | Number of Items Sold | |
| Store A | Store B | |
| GrillToaster
Oven Blender Coffee maker |
4035
30 40 35 |
2015
30 30 40 |
Represent the above data by a double bar graph.
Answer:
| Item | Number of Items Sold | |
| Store A | Store B | |
| GrillToaster
Oven Blender Coffee maker |
4035
30 40 35 |
2015
30 30 40 |
The double graph of the above given data is given below:
Data Handling Exe-19.1
ML Aggarwal Class 8 ICSE Maths Solutions
Page-327
Question 3. Given below a bar graph:
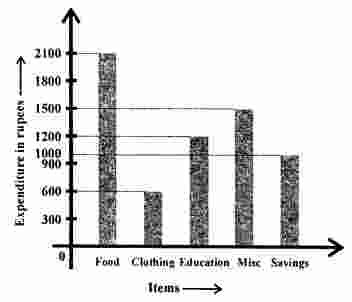
Read the bar graph carefully and answer the following questions:
(i) What is the information given by the bar graph?
(ii) On which item the expenditure is maximum?
(iii) On which item the expenditure is minimum?
(iv) State whether true or false:
Expenditure on education is twice the expenditure on clothing.
Answer:
(i) In the given bar graph, representation of the expenditure of monthly salary on different heads is given.
(ii) On food, expenditure is maximum.
(iii) On clothing expenditure is minimum,
(iv) Yes, it is true.
Question 4. Given below a double bar graph.
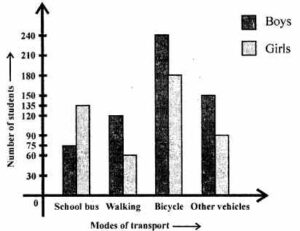
Read the double bar graph carefully and answer the following questions:
(i) What is the information given by the double graph?
(ii) Which mode of transport girls using more than the boys?
(iii) Which mode of transport boys using the most?
(iv) In which mode of transport number of girls is half the number of boys?
Answer:
From the double bar graph:
(i) It represent the number of boys and girls using
different modes of transport for going to school.
(ii) In school bus, girls use more than the boys.
(iii) Boy are using the bicycle most.
(iv) In walking, number of girls is half of the number of boys
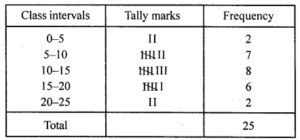
Question 5. Using class intervals 0-5, 5-10, construct the frequency distribution table for the following data:
13, 6, 12, 9, 11, 14, 2, 8, 18, 16, 9, 13, 17, 11, 19, 6, 7, 12, 22, 21, 18, 1, 8, 12, 18.
Answer:
The required frequency table is given below:
Question 6. Given below are the marks secured by 35 students in a surprise test:
41, 32, 35, 21, 11, 47, 42, 00, 05, 18, 25, 24, 29, 38, 30, 04, 14, 24, 34, 44, 48, 33, 36, 38, 41, 48, 08, 34, 39, 11, 13, 27, 26, 43, 03.
Taking class invervals 0-10, 10-20, …….. construct frequency distribution table. Find the number of students obtaining below 20 marks.
Answer:
Below is given the frequency table of the given data:
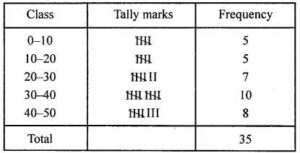
Number of students getting below 20 marks are = 5 + 5 = 10
Data Handling Exe-19.1
ML Aggarwal Class 8 ICSE Maths Solutions
Page-328
Question 7. Draw a histrogram for the frequency table made for data in Example 4, and answer the following questions:
(i) Which group has the maximum number of houses?
(ii) How many houses pay less than ₹ 100?
(iii) How many houses pay ₹ 100 or more?
Answer:
Histogram of the given data in Example 4, is given below:
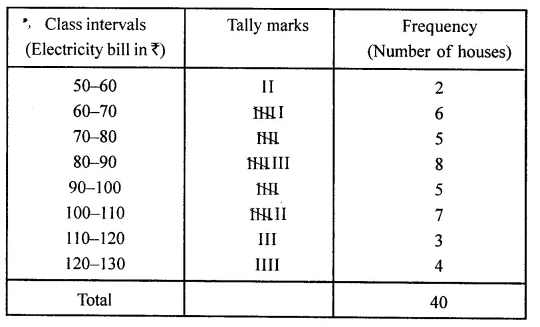
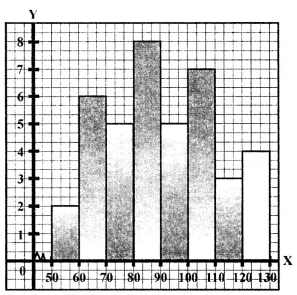
(i) Maximum number of house are in the group 80-90.
(ii) Number of houses who play less then ₹100 = 2 + 6 + 5 + 8 + 5 = 26
(iii) Number of houses who pay ₹ 100 or more = 7 + 3 + 4= 14
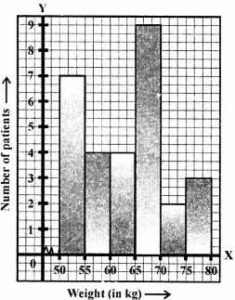
Question 8. The weights of 29 patients in a hospital were recorded as follows:
| Weight (in kg) | 50-55 | 55-60 | 60-65 | 65-70 | 70-75 | 75-80 |
| Number of patients | 7 | 4 | 4 | 9 | 2 | 3 |
Draw a histogram to represent this data visually.
Answer:
| Weight (in kg) | 50-55 | 55-60 | 60-65 | 65-70 | 70-75 | 75-80 |
| Number of patients | 7 | 4 | 4 | 9 | 2 | 3 |
The histogram of the above-given data is given below:
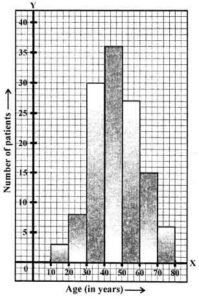
Question 9. In a study of diabetic patients, the following data was obtained:
| Age (in years) | 10-20 | 20-30 | 30-40 | 40-50 | 50-60 | 60-70 | 70-80 |
| Number of patients | 3 | 8 | 30 | 36 | 27 | 15 | 6 |
Represent the above data by a histogram.
Answer:
| Age (in years) | 10-20 | 20-30 | 30-40 | 40-50 | 50-60 | 60-70 | 70-80 |
| Number of patients | 3 | 8 | 30 | 36 | 27 | 15 | 6 |
The histogram representing the above-given data is given below:
Question 10. The histogram showing the weekly wages (in ₹) of workers in a factory is given alongside:
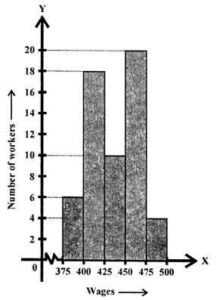
Answer the following:
(i) What is the frequency of class 400-425?
(ii) What is the class having a minimum frequency?
(iii) How many workers get more than ₹425?
(iv) How many workers get less than ₹475?
(v) Number of workers whose weekly wages are more than or equal to ₹400 but less than ₹450.
Answer:
In the given histogram showing the weekly wages of workers in a factory.
(i) Frequency of class 400-425 is 18.
(ii) Class 475-500 has the minimum frequency.
(iii) Number of workers getting more then ₹425 is 34.
(iv) Number of workers getting less than ₹475 is 54.
(v) Number of workers whose weekly wages is more than
or equal to ₹400 but less than ₹450 = 28.
Question 11. The number of hours for which students of a particular class watched television during holidays is shown in the histogram below.

Answer the following:
(i) For how many hours did the maximum number of students watch T.V.?
(ii) How many students watched T.V. for less than 4 hours?
(iii) How many students spent more than 5 hours in watching T.V.?
(iv) How many students spent more than 2 hours but less than 4 hours in watching T.V.?
Answer:
From the histogram given,
(i) Maximum number of students who watch 4-5 hours.
(ii) Number of students who watch T.V. for less than 4 hours is 34.
(iii) Number of students who spent more than 5 hours in watching the T.V. is 14.
(iv) Number of students who spent more than 2 hours
but less than 4 hours watching T.V. is 30.
— End of Data Handling Exe-19.1 Class 8 ICSE Maths Solutions :–
Return to : – ML Aggarwal Maths Solutions for ICSE Class -8
Thanks


