OP Malhotra Notes on Mean Median and Frequency Polygon Class-9 S.Chand ICSE Maths. We Provide Step by Step Answer on Mean, Median, Mode and Frequency Polygon of S Chand OP Malhotra Maths . Visit official Website CISCE for detail information about ICSE Board Class-9.


OP Malhotra Mean Median and Frequency Polygon Class-9 S.Chand ICSE Maths
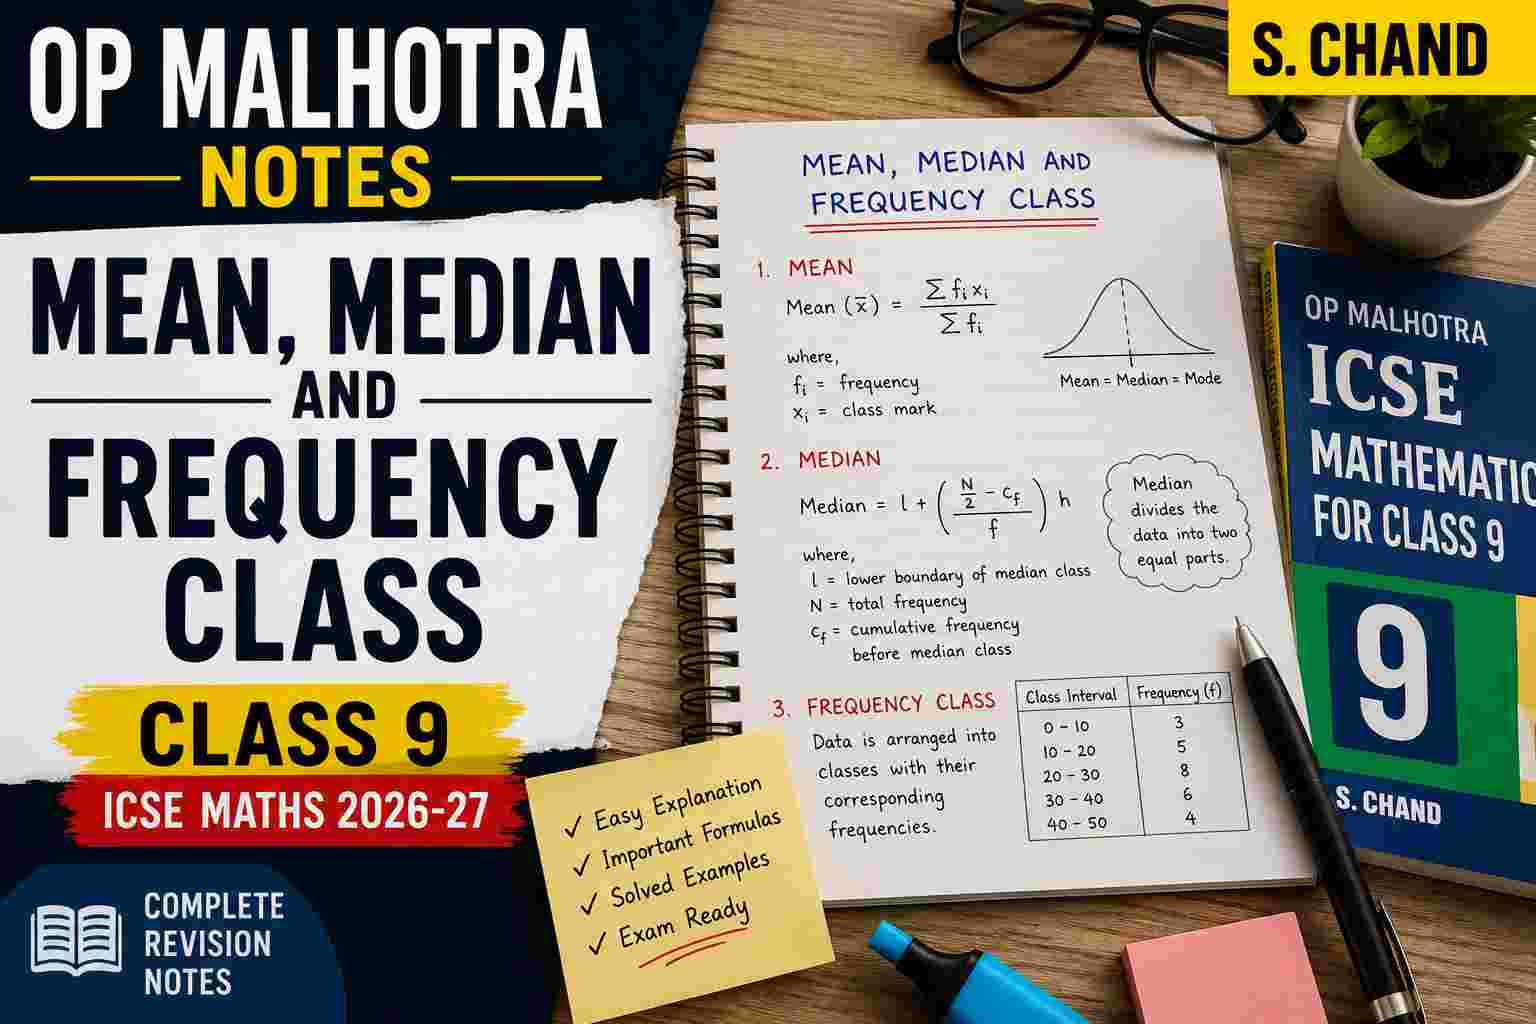
Mean Definition
The mean is the average of the number of observations. It is calculated by dividing the sum of the values of the observations by the total number of observations.
Mean of Grouped Data (Without Class Interval) :
If the data is organized in such a way that the frequency is given but there is no class interval then we can calculate the mean by
Formula : Mean = x¯=∑xi/n
where, xi = sum of all value
n = Total no. of values
Practice Questions on Mean :- Exercise-15(a)
Median Definition:
The median is the middle value of the given number of the observation which divides into exactly two parts.
For median of ungrouped data, we arrange it in ascending order and then calculated.
Formula : For odd numbers
Median = (n+1)/2 term
For even numbers
Median = mean of n/2 th and (n+1)/2 th term
Practice Questions on Median :- Exercise-15(b)
Mode Definition:
The mode is the value of the observation which shows the number that occurs frequently in data i.e. the number of observations which has the maximum frequency is known as the Mode.
Exclusive form of data:
This above table is expressed in the exclusive form.
In this, the class intervals are 0 – 10, 10 – 20, 20 – 30. In this, we include lower limit but exclude upper limit.
So, 10 – 20 means values from 10 and more but less than 20.
20 – 30 would mean values from 20 and more but less than 30.
Frequency Polygon :
The relevance of presentation of data in the pictorial or graphical form is immense. Frequency polygons give an idea about the shape of the data and the trends that a particular data set follows. Let us learn the step by step process of drawing a frequency polygon, with or without a histogram.
Steps to Draw a Frequency Polygon :
- Mark the class intervals for each class on the horizontal axis. We will plot the frequency on the vertical axis.
- Calculate the classmark for each class interval. The formula for class mark is:
Classmark = (Upper limit + Lower limit) / 2
- Mark all the class marks on the horizontal axis. It is also known as the mid-value of every class.
- Corresponding to each class mark, plot the frequency as given to you. The height always depicts the frequency. Make sure that the frequency is plotted against the class mark and not the upper or lower limit of any class.
- Join all the plotted points using a line segment. The curve obtained will be kinked.
- This resulting curve is called the frequency polygon.
how to construct a frequency polygon?
In order to create a frequency polygon, one must follow these steps:
-
- Creation of a histogram.
- Finding the midpoints for each bar that exists on the histogram.
- Placing a point on the origin of the histogram and its end.
- Connection of the points.
What is a frequency polygon :
The frequency histogram has the similarity to a column graph without the presence of spaces between columns. The frequency polygon happens to be a special line graph whose use takes place in statistics. One can draw these graphs either separately or combined. One can make use of the information that is available in a frequency distribution table for drawings of these graphs.
Differentiate between a frequency polygon and frequency curve :
The major difference between a frequency polygon and frequency curve is that the drawing of a frequency polygon by joining points by a straight line while the drawing of a frequency curve takes place by a smooth hand.
Practice Questions on mode and frequency Table :- Exercise-15(c)
In this chapter, we study all the topics on Mean Median and Frequency Polygon and do some practice questions also. Here we solve extra practice questions on this chapter for better understanding.
For extra practice questions on Mean Median and Frequency Polygon :- Chapter Test
— : End of Mean Median and Frequency Polygon OP Malhotra S Chand Solutions :–
Return to :– OP Malhotra S Chand Solutions for ICSE Class-9 Maths
Thanks
Please Share with Your Friends